|
|
| (222 intermediate revisions by the same user not shown) |
| Line 1: |
Line 1: |
| | Development of a Positron source using a PbBi converter and a Solenoid | | Development of a Positron source using a PbBi converter and a Solenoid |
| | | | |
| − | =Task List= | + | =Conclusions= |
| | | | |
| − | 1.) new electron and positron files for the case of two 0.25 mm thick SS windows around the PbBi target.
| + | #A 0.3 (0.6) Tesla Solenoid with a diameter to allow a 9.74 (3.94) cm diameter pipe would collect a positron per thousand incident electrons on a 2mm thick LBE target with 0.25 mm thick SS windows. |
| | + | # A 15 cm long, 0.2 Tesla solenoid with a 3.94 diameter beam pipe would collect a positron per two thousand electrons impinging a 2mm thick LBE target with 0.25 mm thick SS windows. |
| | + | #A 4 Tesla Solenoid will remove beam pipe heating from scattered electrons downstream of the target when using a 3.94 cm diameter beam pipe. |
| | | | |
| − | 2.) Determine electron energy deposition in SS pipe per cm^2 of pipe surface area for pipes with a radius of 34.8, 47.5, 60.2, 72.9, and 97.4 mm and thickness of 5mm along the z-axis.
| + | =Reports= |
| | | | |
| − | 3.) Insert uniform B-field that can be scaled from 0 to 0.3 and 1 Telsa.
| + | [[Niowave_Report_11-30-2015]] |
| | | | |
| − | =Beam Pipe Heating=
| |
| | | | |
| | + | deadline 4/12/16 |
| | | | |
| − | A 10 MeV electron beam with a radius of 0.5 cm was incident on a 2 mm thick PbBi target. The target is positioned at Z = -902 mm. The plot below shows the energy deposited in MeV along the pipe. The Z axis is along the beam direction. The distance around the beam pipe is determine by taking the pipe radius (34.8 mm) and multiplying it by the Phi angle around the pipe. The bins are 1cm x 1cm.
| |
| | | | |
| | + | ==[[Niowave_9-2015]]== |
| | + | ==[[Niowave_10-2015]]== |
| | + | ==[[Niowave_11-2015]]== |
| | + | ==[[Niowave_12-2015]]== |
| | + | ==[[Niowave_1-2016]]== |
| | + | ==[[Niowave_2-2016]]== |
| | + | ==[[Niowave_3-2016]]== |
| | + | ==[[Niowave_4-2016]]== |
| | + | ==[[Niowave_5-2016]]== |
| | + | ==[[Niowave_6-2016]]== |
| | | | |
| | + | =Task List= |
| | | | |
| − |
| + | 0.) 34.8 mm pipe, 0.0 -> 0.5 Tesla, E= 6,8,10 MeV. |
| − | {| border="1"
| |
| − | | [[File:BeamPipeDepEPhi_34.8_082815.png |200px]] ||[[File:BeamPipeDepE_34.8_082815.png| 200 px]]
| |
| − | |+ A maximum of 450,000 MeV is deposited in a 1 cm<math>^2</math> bin when 20 Million , 10 MeV electrons are incident on a 2 mm thick PbBi target located at Z=-902 mm.
| |
| − | |}
| |
| | | | |
| | | | |
| − | Beam Power = E(MeV) <math> \cdot </math>I (<math>\mu</math> A) = 10 MeV <math>\times</math> 1000 mA = 10 kW
| + | 1.) Create a positron (10,000 positrons) and electron event file containing t,x,y,z,Px,Py,Pz for positrons exiting the solenoid and an incident Gaussian beam 1cm in diameter and with a sigma of 1cm. |
| | | | |
| − | If all of the beam power goes into a 100 cm long beam pipe with a radius of 3.38 cm then the power deposited per area would be
| + | compare distributions with and without solenoid. |
| | | | |
| − | :<math>10000 \mbox{W} \times \frac{1}{100 \mbox{cm}}\times \frac{1}{2 \pi \times 3.48 \mbox {cm} } = 4.6 \frac{\mbox{W}}{\mbox{cm}^2}</math>
| + | 2.) Determine the back ground when using a 3.48 diameter beam pipe and Solenoid field of 0.2 for a NaI detector placed at |
| | | | |
| − | Projections onto the Z-axis
| + | 3.) Experiment, install dipole and solenoid in the tunnel. |
| | | | |
| − | GEANT4 predicts that scattered electrons, photons, and positrons (mostly scattered electrons) deposit
| + | =Beam Pipe Heating= |
| | | | |
| − | :<math>1.06371 \times 10^6</math> MeV
| + | [[PbBi_BeamPipeHeatin_2015]] |
| | | | |
| − | of energy in a 0.5mm thick beam pipe having a radius of 3.48 cm and a length of 100 cm surrounding a 2 mm thick PbBi target located 10 cm from one end of the pipe
| + | =Converter target properties= |
| − | and impinged by 2 \times 10^{7}, 10 MeV electrons.
| |
| | | | |
| − | If each electron uniformly distributed this energy along the beam pipe I would see
| |
| | | | |
| − | :<math>7.3191 \times 10^9 \mbox{keV} \times \frac{1}{100 \mbox{cm}}\times \frac{1}{2 \pi \times 3.48 \mbox {cm} } \times \frac{1}{2 \times 10^7 \mbox{e}^-}= 0.17 \frac{\mbox{keV}}{\mbox{cm}^2 \;\;\mbox{e}^-}</math>
| + | [[PbBi_NioWave_TargetProperties_2015]] |
| | | | |
| − |
| |
| − | {| border="1"
| |
| − | | [[File:BeamPipeDepEmev_34.8_082915.png |200px]]
| |
| − | |+ Energy deposited (MeV) in a 1 m long 3.48 cm radius beam pipe surrounding a 2 mm target located at Z=-902 mm when 20 million electrons impinge the target.
| |
| − | |}
| |
| | | | |
| − | According to the above figure, GEANT4 predicts a total of <math>1.064 \times 10^7</math> MeV/cm (the integral adds up the energy in each 1cm bin) of energy will be deposited in
| + | =Target thickness optimization= |
| − | a 1m long beam pipe surrounding a 2 mm thick PbBi target located at Z=-902 mm when 20 million electrons impinge the target.
| |
| − | <math>\left( \frac{1.064 \times 10^7\mbox{MeV}}{2 \times 10^7 \mbox{e}^- \;\; cm}\right) = \frac{500\mbox{keV} }{\mbox{e}^- }</math>
| |
| | | | |
| − | If all of this energy were UNIFORMLY distriuted along the 3.48 cm radius pipe then the energy deposited per area would be
| + | ==[[PbBi_THickness_CylinderBeam]]== |
| | | | |
| − | <math>\left(\frac{ 500 \mbox{keV}}{ 2 \pi \times 3.48 \;\; \mbox{cm}^2 \;\; \mbox{e}^-}\right) \sim \frac{23 \; \mbox{keV} }{ \mbox{cm}^2\;\; \mbox{e}^- }</math>
| + | ==[[PbBi_THickness_GaussBeam]]== |
| | | | |
| | + | == [[PbBi_THickness_PntSource]]== |
| | | | |
| − | if you assume a 1 mA beam of electrons then this becomes
| + | =Solenoid= |
| | | | |
| − | <math>\left ( \frac{23 \; \mbox{W} }{ \mbox{cm}^2 } \right) </math>
| + | ==Uniform ideal Solenoid== |
| | | | |
| − | Problem: adding the energy up by hand contradicts the weighted histogram by factor of 100? SHouldn't the 1 cm bins alpong Z take care of the division by 100?
| + | === [[PbBi_BeamPipeHeating_w_Solenoid_2015]]=== |
| | | | |
| − | If you use the above factors to weight the histogram, then the figure below shows that GEANT4 predicts a power deposition density of <math>= 0.76 \frac{W}{cm^2}</math>, 3 cm downstream of the target.
| + | ===[[PbBi_60cmLong_Solenoid_Collection_Efficiency_2015]]=== |
| − | The total power density deposited on a 1 m long beam pipe is <math>= 24 \frac{W}{cm^2}</math>. Back scattered electrons appear to creat the hottest spot of <math>= 2.6 \frac{W}{cm^2}</math> about 3cm upstream of the target.
| |
| − |
| |
| − | {| border="1"
| |
| − | | [[File:BeamPipeDepE_34.8mmA_082815.png| 200 px]] ||[[File:BeamPipeDepE_34.8mmB_082815.png| 200 px]]
| |
| − | |-
| |
| − | | Power Depositrion Zoomed in and 902 mm offset applied ||Power deposition over the 1 m long beam pipe
| |
| − | |-
| |
| − | |}
| |
| | | | |
| − | I converted the above histogram to deposited power you would divide by the number of incident electrons, divide by the circumference of the beam pip, multiple the beam current, and use a unit conversion from MeV to W-s per MeV.
| + | ==Positron & Electron event files== |
| | | | |
| − | <math>\left(Counts \frac{\mbox{MeV}}{\mbox{cm}}\right) \times \left( \frac{1}{2 \times 10^{7} \mbox{e}^-} \right ) \times \left( \frac{1}{2 \times \pi \times 3.48 \mbox{cm}} \right ) \times \left( \frac{1. \times 10^{-3}\mbox{ C}}{\mbox{s} }\right )\times \left( \frac{\mbox{e}^- }{1.6 \times 10^{-19}\mbox{ C}}\right ) \left( \frac{1.6 \times 10^{-13}\mbox{W} \cdot \mbox{ s}}{\mbox{MeV} }\right ) \times </math>
| + | [[PbBi_PosEventFiles_VaccumGaps_2015]] |
| | | | |
| | + | [[PbBi_PosEventFiles_NoGaps_2016]] |
| | | | |
| | + | ==Solenoid Map== |
| | | | |
| | + | Inner Radiusu= |
| | | | |
| − | Below is energy deposited contributions from from photons(AVSzWg), positrons (AVSzWpos), and electrons.
| + | Outer Radius = |
| | | | |
| | + | Length = |
| | | | |
| − | [[File:BeamPipeDepE_34.8_082815_parttype.png | 200 px]]
| + | Current= |
| | | | |
| − | Why is the positron hotspot upstream of the target?
| + | Magnetic Field Map in cylindrical coordinates (Z & R) from Niowave |
| − | | |
| − | | |
| − | | |
| − | | |
| − | | |
| − | root commands used
| |
| − | | |
| − | TH2D *AVSz=new TH2D("AVSz","AVSz",100,-1000,0,12,-60,60)
| |
| − | BeamPipeE->Draw("35.*atan(PosYmm/PosXmm):PosZmm>>AVSz","DepEmeV");
| |
| − | AVSz->Draw("colz");
| |
| − | | |
| − | | |
| − | | |
| − | [[BeamPipeHeating_4mmthick_PbBi_PositronTarget]]
| |
| | | | |
| − | ==Unit conversion== | + | =Rear Window Thickness= |
| | | | |
| − | The energy deposited by photon, electrons, and positrons is predicted by GEANT4 and recorded in energy units of keV per incident electron on the PbBi target. To convert this deposited energy to a power you need to assume a beam current. Assuming 1 beam current of 1 mA, the conversion is given easily as
| |
| | | | |
| − | <math>\left( \frac{\mbox{keV}}{\mbox{cm}^2 \mbox{e}^-}\right) \times \left( \frac{ \mbox{e}^-}{1.6 \times 10^{-19}\mbox{C}} \right ) \times \left( \frac{1 \times 10^{-3} \mbox{C}}{\mbox{s}} \right ) \times \left( \frac{1.6 \times 10^{-16}\mbox{W} \cdot \mbox{ s}}{\mbox{keV} }\right )</math>
| + | Question: Will a thicker downstream exit window increase the positron production efficiency by providing more material for a brehm photon to pair produce in? |
| | | | |
| − | <math>\left( \frac{\mbox{keV}}{\mbox{cm}^2 \mbox{e}^-}\right) = \left( \frac{\mbox{W} }{\mbox{cm}^2 } \right )</math>
| |
| | | | |
| − | ==Results Table==
| + | Positrons were counted exiting a ideal 0.2 Tesla solenoid that was 15 cm long. A ten MeV electron beam with a 0.5 cm cylindrical radius impinged a 2mm thick PbBi liquid target that had a surface area of 2.54 cm x 2.54 cm. A 0.25 mm thick stainless steel entrance window was used. |
| | | | |
| | + | Target is at -106 mm, entrance SS window is at -108.25 mm , exit SS window is at -103.75 mm, A sensitive detector for positron is placed at Z= +44mm. The sensitive detector is a cylinder of radius 11.74 cm. |
| | | | |
| | {| border="1" | | {| border="1" |
| | {| border="1" | | {| border="1" |
| − | | Beam Pipe Radius (mm) || Hot Spot (<math>keV/cm^2/e^-</math>) | + | | SS Exit WIndow Thickness (mm) || Positrons/Million electrons |
| | |- | | |- |
| − | | 34.8 || 5 | + | |0.0 || 1142,1096,1149,1073,1083 = 1109 +/- 35 |
| − | |-
| + | |- |
| − | | 47.5 ||
| + | | 0.25 || 774,836,800,785,798 = 798 +/- 23 |
| − | |- | |
| − | | 60.2 || | |
| | |- | | |- |
| − | | 72.9 || | + | | 0.5 || 693,704,713,697,715 = 704 +/- 10 |
| | |- | | |- |
| − | | 97.4 || | + | | 1.0 || 587,606,548,592,550 =577 +/- 26 |
| − | |- | + | |+ |
| | |} | | |} |
| | | | |
| − | =Converter target properties=
| |
| − |
| |
| − | Definition of Lead Bismuth
| |
| − |
| |
| − |
| |
| − | 1cm diameter target
| |
| − | 2 mm thick PbBi
| |
| − |
| |
| − | 0.5 Tesla solenoid
| |
| − |
| |
| − |
| |
| − | Desire to know
| |
| − |
| |
| − | Emmittance (mrad * mm)
| |
| − |
| |
| − | dispersion (Delta P/P) (mradian/1000th mm/1000th)
| |
| − |
| |
| − | of electrons after the PbBi target.
| |
| − |
| |
| − |
| |
| − | pole face rotation in vertical plane.
| |
| − |
| |
| − | =G4BeamLine and MCNPX=
| |
| − |
| |
| − |
| |
| − | ==Target thickness optimization==
| |
| − |
| |
| − | ===[[PbBi_THickness_GaussBeam]]===
| |
| − | Dmitry's processing of Tony's GEANT simulations showing transverse phase space portrait (left) and longitudinal phase space portrait (right). Phase space portraits show coordinate x or y vs
| |
| − | diveregense=px/pz or py/pz (or time vs kinetic energy ). Captions show:
| |
| − |
| |
| − | 1. geometric (not normalized) emittance for transverse and emittance for longitudinal phase space portraits (ellipse areas divided by "pi")
| |
| − |
| |
| − | 2. Twiss parameters
| |
| − |
| |
| − | 3. Ellipse centroid for longitudinal phase portrait
| |
| − |
| |
| − | 4. sqrt(beta*emittance) and sqrt(gamma*emittance) - half sizes of the projections of the ellipses on the coordinate and divergence axes respectively.
| |
| − |
| |
| − | Electrons - RMS
| |
| − |
| |
| − | [[File:Ed1.png| 400 px]]
| |
| − |
| |
| − | Electrons - 68.2% core
| |
| − |
| |
| − | [[File:Ed2.png| 400 px]]
| |
| − |
| |
| − | Positrons - RMS
| |
| − |
| |
| − | [[File:Pd1.png| 400 px]]
| |
| − |
| |
| − | Positrons - 68.2% core
| |
| − |
| |
| − | [[File:Pd2.png| 400 px]]
| |
| − |
| |
| − | === [[PbBi_THickness_CylinderBeam]]===
| |
| − | Dmitry's processing of Tony's GEANT simulations showing transverse phase space portrait (left) and longitudinal phase space portrait (right). Phase space portraits show coordinate x or y vs
| |
| − | diveregense=px/pz or py/pz (or time vs kinetic energy ). Captions show:
| |
| − |
| |
| − | 1. geometric (not normalized) emittance for transverse and emittance for longitudinal phase space portraits (ellipse areas divided by "pi")
| |
| − |
| |
| − | 2. Twiss parameters
| |
| − |
| |
| − | 3. Ellipse centroid for longitudinal phase portrait
| |
| − |
| |
| − | 4. sqrt(beta*emittance) and sqrt(gamma*emittance) - half sizes of the projections of the ellipses on the coordinate and divergence axes respectively.
| |
| − |
| |
| − | Electrons - RMS
| |
| − |
| |
| − | [[File:E1.png| 400 px]]
| |
| − |
| |
| − | Electrons - 68.2% core
| |
| − |
| |
| − | [[File:E2.png| 400 px]]
| |
| − |
| |
| − | Positrons - RMS
| |
| − |
| |
| − | [[File:P1.png| 400 px]]
| |
| − |
| |
| − | Positrons - 68.2% core
| |
| − |
| |
| − | [[File:P2.png| 400 px]]
| |
| − |
| |
| − | === [[PbBi_THickness_PntSource]]===
| |
| − |
| |
| − | Electrons and Positrons after 2mm of LBE:
| |
| − |
| |
| − | Electrons:
| |
| − |
| |
| − | [[File:e01.png| 200 px]][[File:e02.png| 200 px]]
| |
| − |
| |
| − | Positrons:
| |
| | | | |
| − | [[File:p01.png| 200 px]][[File:p02.png| 200 px]]
| + | ;Conclusion 1: Positron production efficiency improves when the exit window is made thinner |
| | | | |
| − | ===Energy Deposition in Target system (Heat)===
| + | ;Conclusion 2 : You loose about 28 +/- 4 % of the positrons in the 0.25 mm thick SS exit window. |
| | | | |
| | + | =Background studies= |
| | | | |
| − | [[File:ElectronTracks.png| 200 px]][[File:PhotonTracks.png| 200 px]]
| + | ==Brem Spectrum== |
| | | | |
| − | [[File:ElectronEnergy.png| 200 px]][[File:PhotonEnergy.png| 200 px]]
| + | Below is the photon energy distribution (from Brem & pair production) using a 2mm Pb target for two different incident electron energies; 6 and 10 MeV. The photons are 1 cm downstream of the target and intersection a large forward region. |
| | | | |
| − | MCNPX simulations of energy deposition into different cells are below. There is a slight overestimate (they add up to about 120%). Positrons contribute less than 1% of electrons' contribution. No magnetic filed is assumed.
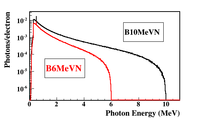
| + | [[File:PbBi_Brem_6-10MeV_4-7-16.png | 200 px]] |
| | | | |
| − | [[File:Model.png| 400 px]]
| + | insert photon spacial distributions |
| | | | |
| − | [[File:Tablen1.png| 200 px]]
| + | Now move the scoring region downstream to a position representing the location of a NaI detector. |
| − | | |
| − | [[File:Tablen2.png| 200 px]]
| |
| − | | |
| − | ==Solenoid==
| |
| − | | |
| − | | |
| − | Inner Radiusu=
| |
| − | | |
| − | Outer Radius =
| |
| − | | |
| − | Length =
| |
| − | | |
| − | Current=
| |
| − | | |
| − | Magnetic Field Map in cylindrical coordinates (Z & R) from Niowave
| |
| | | | |
| | =Beam Line Design= | | =Beam Line Design= |
Development of a Positron source using a PbBi converter and a Solenoid
Conclusions
- A 0.3 (0.6) Tesla Solenoid with a diameter to allow a 9.74 (3.94) cm diameter pipe would collect a positron per thousand incident electrons on a 2mm thick LBE target with 0.25 mm thick SS windows.
- A 15 cm long, 0.2 Tesla solenoid with a 3.94 diameter beam pipe would collect a positron per two thousand electrons impinging a 2mm thick LBE target with 0.25 mm thick SS windows.
- A 4 Tesla Solenoid will remove beam pipe heating from scattered electrons downstream of the target when using a 3.94 cm diameter beam pipe.
Reports
Niowave_Report_11-30-2015
deadline 4/12/16
Task List
0.) 34.8 mm pipe, 0.0 -> 0.5 Tesla, E= 6,8,10 MeV.
1.) Create a positron (10,000 positrons) and electron event file containing t,x,y,z,Px,Py,Pz for positrons exiting the solenoid and an incident Gaussian beam 1cm in diameter and with a sigma of 1cm.
compare distributions with and without solenoid.
2.) Determine the back ground when using a 3.48 diameter beam pipe and Solenoid field of 0.2 for a NaI detector placed at
3.) Experiment, install dipole and solenoid in the tunnel.
Beam Pipe Heating
PbBi_BeamPipeHeatin_2015
Converter target properties
PbBi_NioWave_TargetProperties_2015
Target thickness optimization
Solenoid
Uniform ideal Solenoid
Positron & Electron event files
PbBi_PosEventFiles_VaccumGaps_2015
PbBi_PosEventFiles_NoGaps_2016
Solenoid Map
Inner Radiusu=
Outer Radius =
Length =
Current=
Magnetic Field Map in cylindrical coordinates (Z & R) from Niowave
Rear Window Thickness
Question: Will a thicker downstream exit window increase the positron production efficiency by providing more material for a brehm photon to pair produce in?
Positrons were counted exiting a ideal 0.2 Tesla solenoid that was 15 cm long. A ten MeV electron beam with a 0.5 cm cylindrical radius impinged a 2mm thick PbBi liquid target that had a surface area of 2.54 cm x 2.54 cm. A 0.25 mm thick stainless steel entrance window was used.
Target is at -106 mm, entrance SS window is at -108.25 mm , exit SS window is at -103.75 mm, A sensitive detector for positron is placed at Z= +44mm. The sensitive detector is a cylinder of radius 11.74 cm.
| SS Exit WIndow Thickness (mm) |
Positrons/Million electrons
|
| 0.0 |
1142,1096,1149,1073,1083 = 1109 +/- 35
|
| 0.25 |
774,836,800,785,798 = 798 +/- 23
|
| 0.5 |
693,704,713,697,715 = 704 +/- 10
|
| 1.0 |
587,606,548,592,550 =577 +/- 26
|
- Conclusion 1
- Positron production efficiency improves when the exit window is made thinner
- Conclusion 2
- You loose about 28 +/- 4 % of the positrons in the 0.25 mm thick SS exit window.
Background studies
Brem Spectrum
Below is the photon energy distribution (from Brem & pair production) using a 2mm Pb target for two different incident electron energies; 6 and 10 MeV. The photons are 1 cm downstream of the target and intersection a large forward region.
insert photon spacial distributions
Now move the scoring region downstream to a position representing the location of a NaI detector.
Beam Line Design
PbBi_BeamLine_Elements
goals for JLab
Positrons#Simulations
