JackPhotonFlux 06-04-2018
PAA_ResultsFromTheIAC#Jack_Photon_Flux
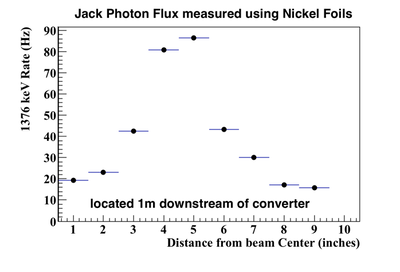
Jack Profile from Nickel foils 1m from converter
Filename:Jack_6-4-2018_002
The Rate column values were estimates of the rate in a single channel (1376 keV ) observed online during data acquisition. The rates in the graph above were from an offline analysis integrating over about 20 channels around the 1376 keV peak.
| EventNum(evt.Sec)Time | sample | rate (Hz) |
| 0-45000(0-300) | Thorium | |
| 300-398(430-526) | Position 1 | 4.7 |
| 400-500 (642-742) | Thorium | |
| 500-600 (860-960) | Position 2 | |
| 600-700 (1070-1170) | Thorium | |
| 700-800 (1290-1390) | Position 3 | 10 |
| 800-900 (1500-1600) | Thorium | |
| 900-1000 (1720-1820) | Position 4 | |
| 1000-1125 (1930-2030 | Thorium | |
| 1125-1200 (2040-2140) | Position 5 | 22 |
| 1200-1300 (2150-2250) | Thorium | |
| 1300-1400 (2360-2460) | Position 6 | |
| 1400-1500 (2570-2670 | Thorium | |
| 1500-1600 (2790-2890) | Position 7 | 6.9 |
| 1600-1700 (3010-3110) | Thorium | |
| 1700-1800 (3220-3320) | Position 8 | |
| 1800-1900 (3435-3535) | Thorium | |
| 1900-2000 (3650-3750) | Position 9 | 3.7 |
Calibration
MPA->Draw("evt.Chan*(0.490) >>(6096,0,6096)","evt.Sec > 690 && evt.Sec < 1000");
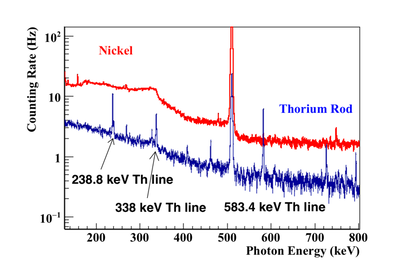
A clear 583 keV peak can be seen for the Thorium rod runs using the command
MPA->Draw("evt.Chan*(0.490) >>(40,560,600)","evt.Sec > 642 && evt.Sec < 742");
There is no 583 keV peak for the Nickel foil.
I do see a 1376 keV line characteristic of the Nickel foil in the Thorium rod spectrum
MPA->Draw("evt.Chan*(0.490) >>(40,1360,1400)","evt.Sec > 1070 && evt.Sec < 1170");
Filename:Jack_6-4-2018_pos002 : Position 1
Filename:Jack_6-4-2018_pos5_001 : Position 5
Filename:Jack_6-4-2018_pos7_001 : Position 7
PAA_ResultsFromTheIAC#Jack_Photon_Flux

