2nCor Equipment
Go back 2nCor_44
Apparatus Map
2017 IAC run on the 44 machine
Neutron&photon_rates_with_CF252
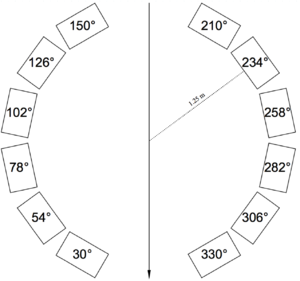
Detector layout
Note: Detectors 102 and 282 are not installed as of march 2017
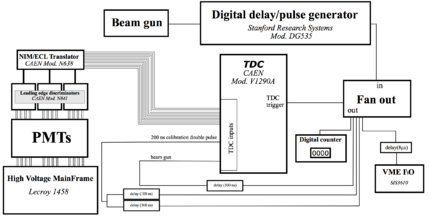
DAQ Setup
DAQ wiring diagram:
HV and threshold values for Aug. 2017 production runs
| Detector | Phi Angle (Degrees) | PMT Position | HV | Discriminator threshold |
|---|---|---|---|---|
| D30 | 30 | Top | -1575 | 30 |
| Bottom | -1450 | 30 | ||
| D54 | 54 | Top | -1400 | 30 |
| Bottom | -1350 | 30 | ||
| D78 | 78 | Top | -1500 | 30 |
| Bottom | -1525 | 30 | ||
| D102 | 102 | Top | -1400 | 30 |
| Bottom | -1300 | 30 | ||
| D126 | 126 | Top | -1500 | 30 |
| Bottom | -1500 | 30 | ||
| D150 | 150 | Top | -1500 | 40 |
| Bottom | -1500 | 40 | ||
| D210 | 210 | Top | -1500 | 40 |
| Bottom | -1500 | 40 | ||
| D234 | 234 | Top | -1500 | 30 |
| Bottom | -1500 | 30 | ||
| D258 | 258 | Top | -1350 | 30 |
| Bottom | -1450 | 30 | ||
| D282 | 282 | Top | -1500 | 50 |
| Bottom | -1500 | 50 | ||
| D306 | 306 | Top | -1450 | 30 |
| Bottom | -1450 | 30 | ||
| D330 | 330 | Top | -1450 | 30 |
| Bottom | -1500 | 30 |
Map for detectors-cables-TDC channels- ROOT variable
As of March 2017
| Detector | Phi Angle (Degrees) | PMT Position | Signal cable label | HV cable label | HV channel on Lecroy Mainframe | LED CH | VNIM-ECL channel | ROOT variable |
|---|---|---|---|---|---|---|---|---|
| D30 | 30 | Top | D30T0.1 | SHV101 | 4:L0.1 | 3-0 | A-0 | evt.TDC[hit #][1] |
| Bottom | D30B0.2 | SHV102 | 4:L0.2 | 2-0 | A-1 | evt.TDC[hit #][2] | ||
| D54 | 54 | Top | D54T2.1 | SHV2.1 | 6:L2.1 | 2-2 | A-2 | evt.TDC[hit #][3] |
| Bottom | D54B2.2 | SHV2.2 | 6:L2.2 | 1-0 | A-3 | evt.TDC[hit #][4] | ||
| D78 | 78 | Top | D78T0.3 | SHV103 | 4:L0.3 | 3-2 | A-4 | evt.TDC[hit #][5] |
| Bottom | D78B0.4 | SHV104 | 4:L0.4 | 1-2 | A-5 | evt.TDC[hit #][6] | ||
| D102 | 102 | Top | D102T1.1 | SHV1.1 | 5:L1.1 | 3-15 | A-6 | evt.TDC[hit #][7] |
| Bottom | D102B1.2 | SHV1.2 | 5:L1.2 | 1-13 | A-7 | evt.TDC[hit #][8] | ||
| D126 | 126 | Top | D126T1.9 | SHV1.9 | 5:L1.9 | 3-5 | B-0 | evt.TDC[hit #][9] |
| Bottom | D126B1.10 | SHV1.10 | 5:L1.10 | 2-5 | B-1 | evt.TDC[hit #][10] | ||
| D150 | 150 | Top | D150T0.5 | SHV105 | 4:L0.5 | 2-7 | B-2 | evt.TDC[hit #][11] |
| Bottom | D150B0.6 | SHV106 | 4:L0.6 | 1-5 | B-3 | evt.TDC[hit #][12] | ||
| D210 | 210 | Top | D210T0.7 | SHV107 | 4:L0.7 | 3-7 | B-4 | evt.TDC[hit #][13] |
| Bottom | D210B0.8 | SHV108 | 4:L0.8 | 1-7 | B-5 | evt.TDC[hit #][14] | ||
| D234 | 234 | Top | D234T2.3 | SHV2.3 | 6:L2.3 | 3-8 | B-6 | evt.TDC[hit #][15] |
| Bottom | D234B2.4 | SHV2.4 | 6:L2.4 | 2-8 | B-7 | evt.TDC[hit #][16] | ||
| D258 | 258 | Top | D258T2.5 | SHV2.5 | 6:L2.5 | 2-10 | A-0 | evt.TDC[hit #][17] |
| Bottom | D258B2.6 | SHV2.6 | 6:L2.6 | 1-8 | A-1 | evt.TDC[hit #][18] | ||
| D282 | 282 | Top | D282T1.7 | SHV1.7 | 5:L1.7 | 3-10 | A-2 | evt.TDC[hit #][19] |
| Bottom | D282B1.8 | SHV1.8 | 5:L1.8 | 2-13 | A-3 | evt.TDC[hit #][20] | ||
| D306 | 306 | Top | D306T1.3 | SHV203 | 5:L1.3 | 2-15 | A-4 | evt.TDC[hit #][21] |
| Bottom | D306B1.4 | SHV204 | 5:L1.4 | 1-10 | A-5 | evt.TDC[hit #][22] | ||
| D330 | 330 | Top | D330T1.5 | shv205 | 5:L1.5 | 3-13 | A-6 | evt.TDC[hit #][23] |
| Bottom | D330B1.6 | shv206 | 5:L1.6 | 1-15 | A-7 | evt.TDC[hit #][24] | ||
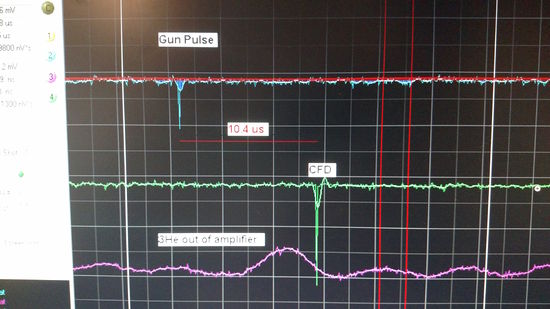
| 200 ns Pulse | B-6 | R1DC->Draw("(TDC.TDC1190[2][31]-TDC.TDC1190[1][31])*0.1") | ||||||
| TDC start (beam gun) | evt.TDC1190[1][32] | |||||||
| He3Tube | R1DC->Draw("(evt.TDC1190[1][28]/10)");FF->Draw("PADC785N[3]") |
2016 run on 44 MeV
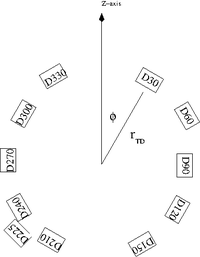
Detector layout
The Xfig file for the above figure : Media:2nCorApp_081216.xfig.txt
Map for detectors-cables-TDC channels- ROOT variable
| Detector | Phi Angle (Degrees) | PMT Position | Signal cable label | HV cable label | HV channel on Lecroy Mainframe | LED CH | VNIM-ECL channel | ROOT variable |
|---|---|---|---|---|---|---|---|---|
| D30 | 30 | Top | D30T001 | SHV101 | 4:L0.1 | 0 | A-0 | evt.TDC[hit #][1] |
| Bottom | D30B002 | SHV102 | 4:L0.2 | 1 | A-1 | evt.TDC[hit #][2] | ||
| D60 | 60 | Top | ||||||
| Bottom | ||||||||
| D90 | 90 | Top | D90T003 | SHV103 | 4:L0.3 | 2 | A-2 | evt.TDC[hit #][3] |
| Bottom | D90B004 | SHV104 | 4:L0.4 | 3 | A-3 | evt.TDC[hit #][4] | ||
| D120 | 120 | Top | D120T201 | SHV201 | 5:L1.1 | 8 | B-0 | evt.TDC[hit #][9] |
| Bottom | D120B202 | SHV202 | 5:L1.2 | 9 | B-1 | evt.TDC[hit #][10] | ||
| D150 | 150 | Top | D150T005 | SHV105 | 4:L0.5 | 4 | A-4 | evt.TDC[hit #][5] |
| Bottom | D150B006 | SHV106 | 4:L0.6 | 5 | A-5 | evt.TDC[hit #][6] | ||
| D210 | 210 | Top | D225T007 | SHV107 | 4:L0.7 | 6 | A-6 | evt.TDC[hit #][7] |
| Bottom | D225B008 | SHV108 | 4:L0.8 | 7 | A-7 | evt.TDC[hit #][8] | ||
| D240 | 240 | Top | ||||||
| Bottom | ||||||||
| D270 | 270 | Top | D270T203 | SHV203 | 5:L1.3 | 10 | B-2 | evt.TDC[hit #][11] |
| Bottom | D270B204 | SHV204 | 5:L1.4 | 11 | B-3 | evt.TDC[hit #][12] | ||
| D300 | 300 | Top | ||||||
| Bottom | ||||||||
| D330 | 330 | Top | pch. pnl. 223E1 | shv205 | 5:L1.5 | B-4 | evt.TDC[hit #][13] | |
| Bottom | pch. pnl 223E7 | shv206 | 5:L1.6 | B-5 | evt.TDC[hit #][14] | |||
| 200 ns Pulse | R1DC->Draw("(evt.TDC1190[2][16]-evt.TDC1190[1][16] |
Detectors
PMTs
http://www.hamamatsu.com/resources/pdf/etd/R580_TPMH1100E.pdf
Scintillators
e+e- spectrometer
PNNL HpGe X-cooler
Detector As Built
GE He-3 detector
DAQ electronics
Signal Processing
Discriminator
CAEN N841
The pulse forming stage of the discriminator produces an output pulse whose width is adjustable in a range from 5 ns to 40 ns. Each channel can work both in Updating and Non-Updating mode according to on-board jumpers position. The discriminator thresholds are individually settable in a range from -1 mV to -255 mV (1 mV step), via an 8-bit DAC. The minimum detectable signal is -5 mV. The back panel houses VETO and TEST inputs, the OR output and the Current Sum output, which generates a current proportional to the input multiplicity, i. e. to the number of channels over threshold, at a rate of -1.0 mA per hit (-50 mV per hit into a 50 Ohm load) ±20%.
| LED output pulse width [arb. units] | Pulse width seen by the oscscope [ns] |
| 10 | 6.3 |
| 20 | 6.6 |
| 40 | 7.1 |
| 60 | 7.6 |
| 90 | 8.5 |
| 120 | 9.5 |
| 160 | 12.0 |
| 190 | 15.1 |
| 230 | 24.8 |
| 250 | 43.5 |
NIM-ECL converter
Phillips Model 726
TDC
TDC VME addresses
TDC1 = 1280
TDC2 = 2391
Detector name convention
- BLUT = Beam Left Upstream Top pmt
3/19/15
- TDC channel Map (Thursday)
| Detector | Angle | TDC channel | NIM-ECL channel | Patch Pannel # | ROOT vaiable |
| BLUT | 135 | TDC 16 | in B ch 0 | 223A6 | evt.TDC[16] |
| BLUB | 135 | TDC 17 | in B ch 1 | 223A7 | evt.TDC[17] |
| BRT | 270 | TDC 24 | in A ch 0 | 223A14 | evt.TDC[24] |
| BRB | 270 | TDC 25 | in A ch 1 | 223A15 | evt.TDC[25] |
| BLDT | 45 | TDC 26 | in A ch 2 | 223A16 | evt.TDC[26] |
| BLDB | 45 | TDC 27 | in A ch 3 | 223A17 | evt.TDC[27] |
| Trig Delay | TDC 30 | in A ch 6 | evt.TDC[30] | ||
| Photon flux monitor | 90 | TDC 29 | in A ch 5 | 223A10 | evt.TDC[29] |
3/24/15
- TDC channel Map 3/24/15
| Detector | Angle | Single hit TDC channel | LED channel | NIM-ECL channel | Patch Pannel # | ROOT vaiable | MultiHit TDC channel |
| 1 top (BRT) | 270 | 24 | 0 | in A ch 0 | 223A5 | evt.TDC[24] | 8 |
| 1 bottom (BRB) | 270 | 25 | 1 | in A ch 1 | 223A6 | evt.TDC[25] | 9 |
| 2 top BLDT | 45 | 16 | 2 | in B ch 0 | 223A7 | evt.TDC[16] | 0 |
| 2 bottom BLDB | 45 | 17 | 3 | in B ch 1 | 223A8 | evt.TDC[17] | 1 |
| 3 top | 60 | 26 | 4 | in A ch 2 | 223A9 | evt.TDC[26] | 10 |
| 3 bottom | 60 | 27 | 5 | in A ch 3 | 223A10 | evt.TDC[27] | 11 |
| 4 top BLUT | 135 | 18 | 6 | in B ch 2 | 223A11 | evt.TDC[18] | 2 |
| 4 bottom BLUB | 135 | 19 | 7 | in B ch 3 | 223A12 | evt.TDC[19] | 3 |
| 5 upstream | 135 | 20 | 10 | in B ch 4 | 223A15 | evt.TDC[20] | 4 |
| 5 downstream | 135 | 21 | 11 | in B ch 5 | 223A16 | evt.TDC[21] | 5 |
| 6 upstream | 135 | 30 | 12 | in A ch 6 | 223A17 | evt.TDC[30] | 14 |
| 6 downstream | 135 | 31 | 13 | in A ch 7 | 223A18 | evt.TDC[31] | 15 |
| e+ spect | 29 | 9 | in A ch 5 | 223A14 | evt.TDC[29] | 13 | |
| Trig Delay | 22 | 14 | in B ch 6 | evt.TDC[22] | 6 |
03/25/15
Wiring Work
- 3/25/2015
- Sean and Glen examined all of the signals from detectors 1 through 6
- We used the signal from the LEMO cables that go directly into the discriminator
- We also used the scope's Acquire->Average option and set the average to 512; This allowed for a more reliable comparison between signals
- Note that the threshold can be adjusted and that the average will be biased toward smaller pulse heights if there is a lot of noise
- Found an RG-62 cable connected between the bottom PMT of Det 3 and the patch panel A10
- Replaced with RG-58 cable
- A10 cable also found to be RG-58 from the experiment room to the counting room; Signal on 3B was degraded in the control room
- Changed to A19 (RG-223 the whole length) and the signal looked similar to the others
- Found that detector 5 top and bottom both were small and have the ~12 ns ringing
- Increased voltage to 1500V
- The non-extending gates from the discriminator will help with this
- Recommend a gate width of 20 to 25 ns from the discriminator to eliminate double pulsing from ringing on Det 5
- Should not matter for other detectors
- Will also not affect high energy neutrons since 6 MeV neutrons are 30 ns ToF at 1 meter
- When testing was complete, verified that all cables are associated with the appropriate detector
- Top/Bottom, Upstream/Downstream should not have been reversed for any detectors in the process but that has not been confirmed; this should be correctable in software
SHV Pasternack connector 4100
BNC Pasternack connector 4944 RG55
ADC
High Voltage Main Frame
Lecroy HV mainfram PS
Channels 4-0 through 4-11 and 5-0 through 5-11 were tested successfully on 03/3/16.
Accelerator
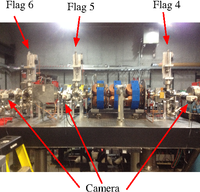
Beam spot flags
Below is a picture of the three "flags" that you can use to the beam spot size using a phosphorus screen.
Software
here is the raw C code for "evio2nt", which is the program we use to create a ROOT tree from a .dat file.
Ntuple maker
To make the Tree containing the TDC, QDC, and PDC data run the following command
source ~/CODA/setup
/home/daq/CODA/CODAreader/ROOT_V5.30/v775v792v785/evio2nt -fr8735.dat >/dev/null
rename the output file to a root file
mv r8735 r8735.root
root -l r8735.root
to draw a histogram for TDC channel 16
DAQ->Draw("evt.TDC[17]>>(4096,0,4096)");
for the multihit TDC data taken with daq2
CODA/CODAreader/ROOT_V5.30/R1DC/evio2nt -fr4516.dat > /dev/null
R1DC->Draw("(evt.TDC1190[1][3])");
R1DC->Draw("(evt.TDC1190[1][6]-evt.TDC1190[2][6])/10>>(4096,-4096,4096)");
On 4/9/2015 the above should be 4000 channel = 400 ns
Analyzing MultiHit TDC runs
setup ROOT on daq 2
source ~/src/root/root-5.34.00/bin/thisroot.csh
IN run 4481 the time difference between the two fake stop pulses seems to be 205.8 ns
R1DC->Draw("(evt.TDC1190[2][6]-evt.TDC1190[1][6])/10");
The relative time of a hit in detector 1 top is given relative to the first fake stop hit using the command
R1DC->Draw("(evt.TDC1190[1][8]-evt.TDC1190[1][6])/10");
Doing the same plot above but this time sending it to a histogram with 1 ns bins
R1DC->Draw("(evt.TDC1190[1][8]-evt.TDC1190[1][6])/10 >> (1000,0,1000)")
