TDC calibration
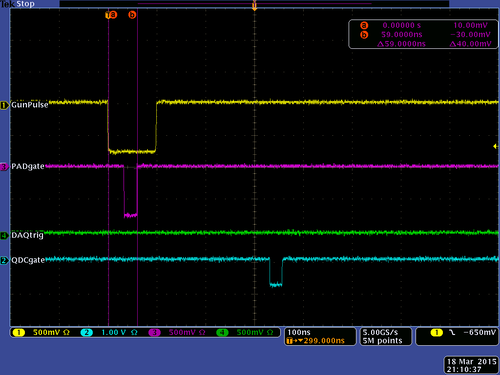
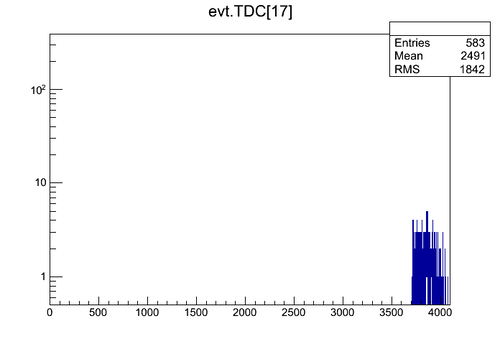
run# 8742: delay dt=59 ns between the rise side of the common start pulse and the fall side of the fake stop signal.
The data look like:
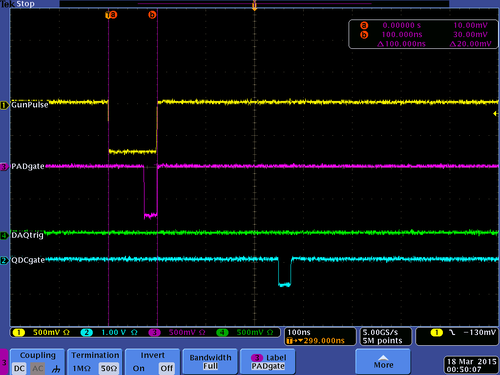
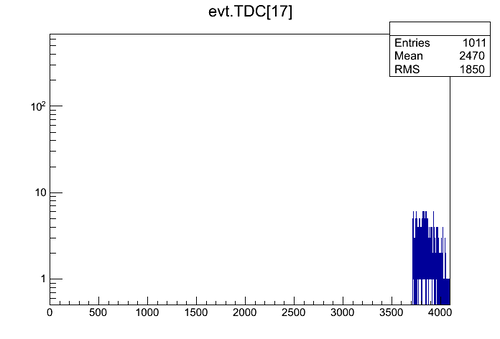
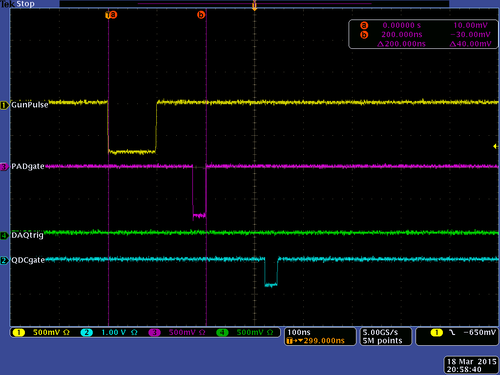
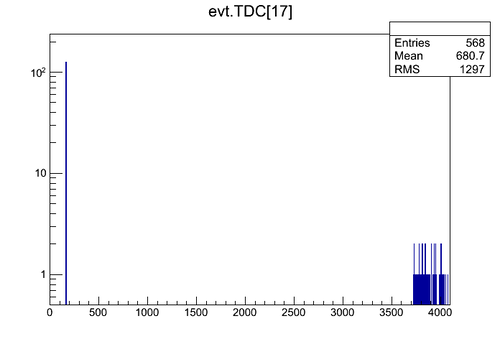
run# 8736: delay dt=100 ns between the rise side of the common start pulse and the fall side of the fake stop signal.
The data look like:
run# 8737: delay dt=200 ns between the rise side of the common start pulse and the fall side of the fake stop signal.
The data look like:
The mean of the peak is at 165.5 channel
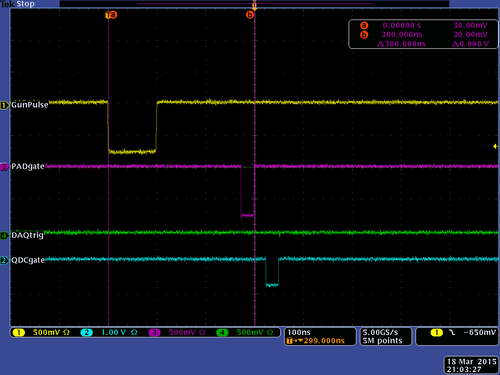
Looking at the data it can be concluded that TDC measures the time difference
between the fall side of the start signal and the fall side of the stop signal.
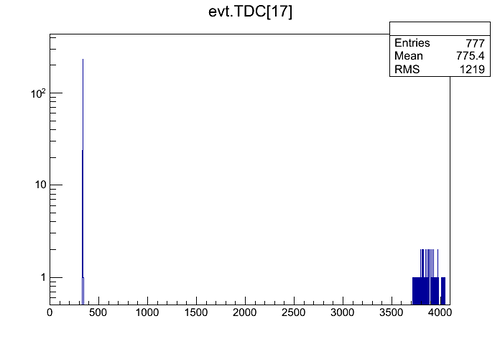
run# 8738: delay dt=300 ns between the rise side of the common start pulse and the fall side of the fake stop signal.
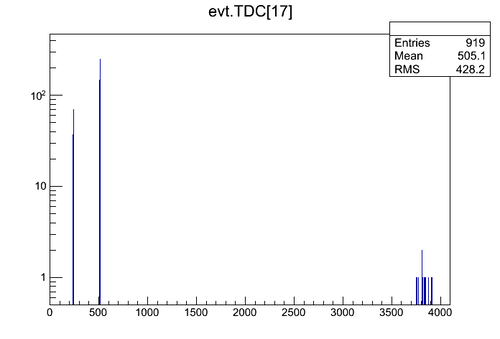
The data look like:
The mean of the peak is at 335.7 channel
run# 8739: delay dt=400 ns between the rise side of the common start pulse and the fall side of the fake stop signal.
The data look like:
The effect of multiple pulsing appeared at this point.
It should be fixed before the production runs start.
The mean of the peak is at 511.5 channel
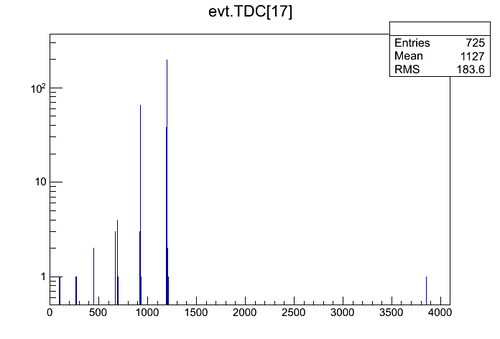
run# 8740: delay dt=800 ns between the rise side of the common start pulse and the fall side of the fake stop signal.
The data look like:
The mean of the "main" peak is at 1197 channel
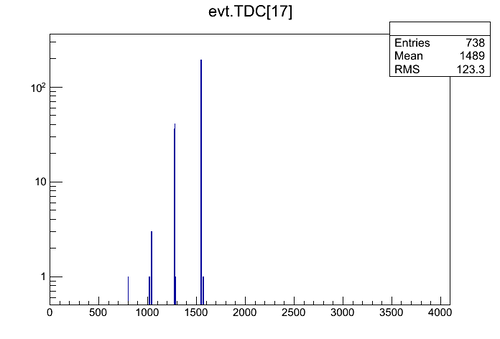
run# 8741: delay dt=1000 ns between the rise side of the common start pulse and the fall side of the fake stop signal.
The data look like:
The mean of the "main" peak is at 1548 channel
Calibration procedure summary
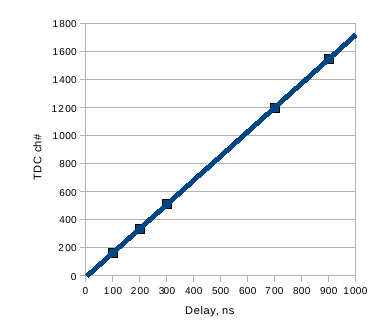
| Delay between fall sides of start/stop, ns | Average TDC ch # |
| 100 | 165.5 |
| 200 | 335.7 |
| 300 | 511.5 |
| 700 | 1197 |
| 900 | 1548 |
TDC calibration plot:
regression line fit y = 1.724728814 x - 7.940677966
The TDC calibration is
