Progress reports
R3 design Progress report
3/11/08
Progress modeling the R3 drift chamber has been held back by both software and hardware problems. This past week we installed ANSYS on a faster computer ( 2 GHz Intel with 3Meg RAM) and were able to render the design in 30 minutes instead of 2 hours. The turnaround for debugging the geometrical design is now faster and ANSY does not currently crash. We plan on doing the same test using a new computer (2 GHz Intel with 8 Meg RAM) once it has been assembled (2 weeks or less).
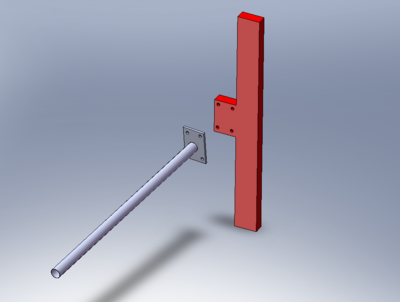
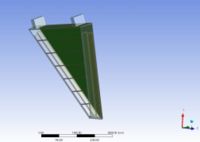
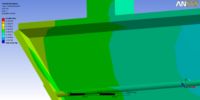
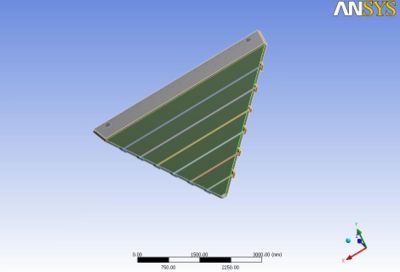
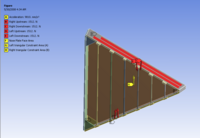
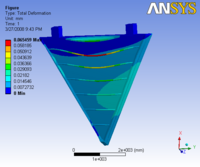
The image below represent the current Model which has been implemented in ANSYS.
3/18/08
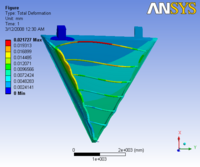
1.) Movies showing deflections as a function of applying the max load and then releasing it. The max deflection is about 13 mm. The two movies below show the two endplate deflections with no rods for either 1 fixed or 2 fixed mount points.
This movie shows the endplate deflection as the wire load is applied and then released. The top two mounting brackets on the back plate are fixed.
The movie below is under similar conditions except the right bracket is allowed to move.
2.) The Max deflections decreases from 13 mm to less than 1 mm if carbon fiber rods are place along the front edge of the endplates. The back plate hinges are both fixed.
http://www.jlab.org/Hall-B/secure/clas12/RIII/ISU_Design/images/Deflection_Rods.avi
3.) The image below shows a max end plate deflection of 0.3 mm when hexcell backing sheet is used and No carbon fiber rods.
 File:Deflection Hexel 2fixedMounts.pdf
4.) A max deflection of 22 microns for the carbon rods and less than 20 microns for the endplate is predicted from our current ANSYS model when both carbon fiber rods and a hexcell backing sheet are used. Only the left hinge is constrained completely and the right hinge is constrained in 2 degrees of freedom. No gravity and no differential gas pressure. Effective Youngs modulus is used. The carbon fiber rods and the hexcell backing sheet are the only materials not made from the poly foam composite. Poly foam used on endplates, back plate, and nose plate. No Al frame around endplate.
3/25/08
5) The max endplate deflection increases from 20 to less than 22 microns when gravity is added. Both the carbon fiber rods and a hexcell backing sheet are used.. The carbon rod deflection increases from 22 to 65 micron with the addition of gravity. Only the left hinge is constrained completely and the right hinge is constrained in 2 degrees of freedom. Gravity is applied along the direction from the back plate towards the Nose plate. The material properties is same as analysis 4
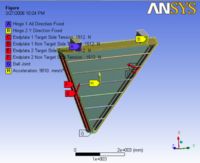
 Media:Deflection_with gravity_3-12-08.pdf
Problems meshing 0.001 inch thick mylar sheet front window. I am able to mesh a XXXX thick sheet. So I adjust Young's Modulus accordingly.
4/14/08
The R3 design is converging to a configuration which results in a max end plate deflection less than 25 microns and more than a factor of 2 smaller than the specifications according to a three dimensional ANSYS model. The effects of gravity are included in this estimate. The impact of the differential pressure has not been included in the model. Attempts to insert a front mylar window into the model and apply a pressure were not successful. A hand calculation will be performed at this time to estimate the effects. The first estimate will consider the force exerted on the carbon rod due to the gas pressure. Is the force exerted by the mylar sheet onto the carbon rod enough to cause the rod to buckle? A second estimate will assume that the carbon rod does move and then distribute the mylar sheet load uniformly along the edges assuming the force produced by the pressure is in the same direction as the wire tension.
4/22/08
The endplate dimensions have been changed this week and were implemented. Bob Miller asked Kalyan to at the effects of the change instead of moving on to the impact of differential pressure.
4/29/08
Bob asked Kalyan to make the changes below to the Drift Chamber design and redo the base analysis(Frame + rods, No Hexcel, no mylar).
1.)Replaced effective Young's modulus with actual layers of SS and polyurethane foam.
2.)Added an Aluminum frame around polyurethane foam
3.) added AL ears onto end plate sides for carbon fiber rods (now rods push against Al instead of foam sandwich)
4.) Dimensions of End plates where changed with the change of widths of super layers; Upstream super layer width from 210.96mm to 188.34mm and downstream super layer width from 210.88mm to 192.42mm
5.) Front face of Nose plate is constrained completely and not floating in space.
The wire tension was applied and the Max end plate deflection changed from 1.17 ( as shown in Table 5.2.1 of the original report, Analysis 3.1) to 0.85 mm.
When Max gravity is applied the end plate Max deflections changes from 0.85 to 3.7 mm.
The orientations and results were shown at the following link Kalyan_4-25-08
Need to freeze design so drawing can begin. Can JLab freeze the design by 5/22/08?
5/6/08
Fixed the following errors in the ANSYS design
1.) Mass is ~350 kg (back plate is poly + SS)
2.) Wire load directions are at 6 degrees now
Remaining problems/tasks
1.) Back plate deflection shows that Back plate is not completely attached to endplate
2.) Hinges are no longer applicable to design. Substitute constraints directly on the Back plate region where the hinges are.
3.) Make back plate and end plates separate parts to limit contact regions
4.) Change Hexcell exit window into two pieces ( 1 carbon fiber and the other the honeycomb). This will remove need for using effective Young's Modulus.
5.) refine the end plate mesh to improve deflection resolution
- Hinge constraints. The coordinate system has the Z- axis along the beam line, and the Y-axis pointing towards the chamber back plate.
| Mount point | Constraint |
| Right Hinge (B) | X,Z |
| Left Hinge (A) | Y,Z |
| Nose plate | X,Z |
5/13/08
The following questions from last week have been addressed.
1.) Back plate deflection shows that Back plate is not completely attached to endplate
Bob Miller sent an image showing that the back plate was not a completely attached to the endplate.
When Kalyan zooms into the same region he does not see a discontinuity.
This seems to illustrate a software problem. ANSYS seems to be able to generate differences in a Model when opened by different users using different computers. It has been suggested that the environment settings on a particular machine can result in auto connections being created differently. Apparently something about Bob's environment setting is not allowing ANSYS to automatically generate a connection between the backplate and endplate like Kalyan's ANSYS environemnt is doing.
2.) Hinges are no longer applicable to design. Substitute constraints directly on the Back plate region where the hinges are.
3.) Make back plate and end plates separate parts to limit contact regions
4.) Change Hexcell exit window into two pieces ( 1 carbon fiber and the other the honeycomb). This will remove need for using effective Young's Modulus.
5.) refine the end plate mesh to improve deflection resolution
Problems 2, 3, 4, 5 were addressed and updated at the table of contents section at http://www.iac.isu.edu/mediawiki/index.php/R3DC_Report_2-08#Table_of_results
| Analysis | Sector Orientation | Hinge A constraint | Hinge B Constraint | Nose Plate | |
| Sector 1 | Analysis 1.1 | 1 | Y,Z | X,Z | X,Z |
| Analysis 1.2 | 1 | X,Z | Y,Z | Y,Z | |
| Sector 4 | Analysis 4.1 | 4 | Y,Z | X,Z | X,Z |
| Analysis 4.2 | 4 | X,Z | Y,Z | Y,Z |
| Deformation (mm) | ||||||
| Analysis | E Max | D Max | X Max | Y Max | Z Max | |
| Sector 1 | Analysis 1.1 | 0.041 | 0.041 | -0.038 | 0.026 | 0.016 |
| Analysis 1.2 | 0.110 | 0.110 | -0.107 | -0.037 | 0.045 | |
| Sector 4 | Analysis 4.1 | 0.056 | 0.056 | 0.051 | 0.031 | 0.027 |
| Analysis 4.2 | 0.107 | 0.107 | 0.107 | 0.032 | -0.043 |
Analysis 1.1 and analysis 4.1 predicted the least deflections for sector 1 and sector 4 respectively. These results were refined by
1. Refining the mesh size.
2. Sandwiching the Hexcel backing sheet with carbon fiber slices.
3. Removing the hinges and applying the constraints over the hinge area.
4. Making single parts for each end plates.
| Deformation (mm) | ||||||
| Analysis | E Max | D Max | X Max | Y Max | Z Max | |
| Sector 1 | Analysis 1.1 Refined | 0.043 | 0.043 | -0.040 | 0.027 | 0.027 |
| Sector 4 | Analysis 4.1 Refined | 0.040 | 0.040 | 0.036 | 0.027 | 0.019 |
- Summary
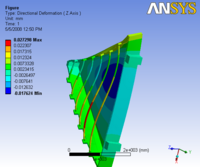
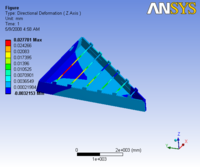
- The above analysis indicates that the nose plate should be constrained in the "X" direction for the least endplate deflection. There is an unusual deflection pattern observed when the exit window part is meshed ("refined" analysis). The exit window deflection is observed to have oval concentric contours when the Hexcell + carbon fiber composite exit window is treated as a single material with an effective Young's modulus. The contours look very different if the three parts of the exit window (carbon fiber + Hexcell + carbon fiber) are meshed separately with their respective Young's modulus.
| Before Meshing | After Meshing |
| Effective Young's modulus | Separate Young's Modulus |
 |
|
Next week:
1.) deflections for other sectors. Table has deflection of the wire.
2.) Why does the mesh deflection look unnatural. In analysis 1.1 defections in the Z direction form circular like contours. Analysis 1.1 "refined" though has Z deflections which have contours that are very different. Perhaps there is a problem with the meshing
5/20/08
1.) changed back plate mounts to be size of linkage
2.) found problem with hexcel exit window Young's modulus being 140,000 MPa instead of 2,000 MPa. In the beginning the exit window was carbon fiber. The effective Young's modulus is 2,000 MPa (Volume weighted) when the exit window is a hexcel-carbon fiber composite. As a result, the deflection changed from 40 to 209 microns.
3.) changing hexcel from 2,000 MPa to 30 MPa and carbon fiber cladding with multiple parts and meshing. Deflections are now 221 microns changes by 12 microns.
4.) changed rods to 3" outer diameter (1 mil wall thickness stays the same) and compare with changing location of back plate mount points.
A recent conversation with sales and technical engineers in hexcel revealed the youngs modulus calculation of Hexcel sheet,
The following procedure was understood for honeycomb hexcel HRH 10-1/8-1.8 sheet.
Data given by them
[K] Compressive Modulus = 8 Ksi
[G] Shear Modulus
in L-direction = 3.8 Ksi
in W-direction = 1.5 Ksi
[E] Young's modulus can be obtained from :
Then
E in L-direction is 9.85 Ksi
E in W-direction is 4.24 Ksi
4.24 Ksi which is equal to 30 Mpa can be used for the analysis [For safety least values have been taken]
This 30 Mpa will be the youngs modulus of the honeycomb hexcel HRH 10-1/8-1.8 sheet.
The effective youngs modulus varies with the choice of slicing and the border casing material.
In our analysis the border casing is aluminum and slices are made of carbon fiber.
1. Using this new young's modulus, the analysis was updated.
2. As per the conversation in last week's meeting, all the six sector orientations were analyzed with the updated view point. The new view point is looking towards the target center from the downstream side of the chamber
- Positive Z will be towards the target center from Region 3
- Positive X will be from Right to left
3. Rectangular Hinge areas were replaced by small circular Areas to simulate Lever Mechanism.
| Deformation (mm) | |||||
| Analysis No. | E Max | D Max | X Max | Y Max | Z Max |
| Sector 1 | 0.196 | 0.221 | 0.195 | 0.126 | -0.088 |
| Sector 2 | 0.158 | 0.234 | 0.089 | -0.233 | -0.047 |
| Sector 3 | 0.236 | 0.262 | -0.127 | -0.257 | -0.075 |
| Sector 4 | 0.230 | 0.258 | -0.232 | -0.146 | -0.100 |
| Sector 5 | 0.190 | 0.243 | -0.132 | 0.242 | -0.050 |
| Sector 6 | 0.213 | 0.266 | 0.099 | 0.265 | -0.061 |
Follow the link for images and PDF result files for all the six sectors generated by ANSYS during the analysis. The new results can be observed at kalyan_16_may_08
For Next Week
1. Move the circular Hinge areas to the upstream side on the back plate and compare results with the same environment where the Hinge areas are on the downstream side (Sector 1)
2. Change the Outer Diameter of the carbon rods from 2 inch - 3 inch, keeping the same thickness
5/27/08
1. Sector 1 was analyzed by changing the hinge locations.
The variation in the results was observed to be negligible
| Deformation (mm) | ||||||
| Sector 1 | E Max | D Max | X Max | Y Max | Z Max | |
| Hinges in the down stream side | 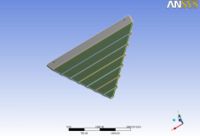 |
0.196 | 0.221 | 0.195 | 0.126 | -0.088 |
| Hinges in the up stream side |  |
0.198 | 0.222 | 0.192 | 0.137 | -0.088 |
Follow the link for images and PDF result files. The new results can be observed at kalyan_23_May_08
2. To reduce the max deformation, the diameter of the carbon rods and the thickness were gradually increased and the results were tabulated as follows
| Deformation (mm) | |||||
| Sector 1 | E Max | D Max | X Max | Y Max | Z Max |
| 3 inch Dia, 0.1 Inch thk Carbon rods | 0.141 | 0.159 | 0.139 | 0.091 | -0.073 |
| 3.5 inch Dia, 0.1 Inch thk Carbon rods | 0.117 | 0.132 | 0.117 | 0.075 | -0.050 |
| 3.5 inch Dia, 0.2 Inch thk Carbon rods | 0.106 | 0.119 | 0.102 | 0.162 | -0.053 |
| 3.5 inch Dia, 0.3 Inch thk Carbon rods | 0.097 | 0.109 | 0.092 | 0.054 | -0.048 |
Follow the link for images and PDF result files. The new results can be observed at kalyan_23_May_08_2.1
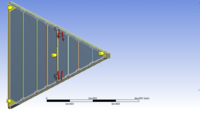
To further reduce the deformation, a new geometric element "Downstream carbon rod" of the same dimensions like other carbon rods is introduced as shown below
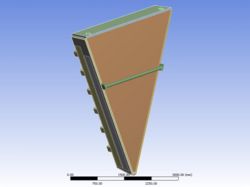 Then the results were tabulated as follows
| Deformation (mm) | |||||
| Sector 1 | E Max | D Max | X Max | Y Max | Z Max |
| 3.5 inch Dia, 0.3 Inch thk Carbon rods with 1 rear rod | 0.090 | 0.101 | 0.087 | 0.053 | -0.042 |
| 3.5 inch Dia, 0.5 Inch thk Carbon rods with 1 rear rod | 0.084 | 0.095 | 0.083 | 0.047 | -0.037 |
Follow the link for images and PDF result files. The new results can be observed at kalyan_23_May_08_2.2
In the next approach, the thickness of the polyurethane layer in the end plates were increased from 2 inches to 2.5 inches with carbon rods of 3.5 inch diameter and 0.5 inch thk including the single rear carbon rod.
| Deformation (mm) | |||||
| Sector 1 | E Max | D Max | X Max | Y Max | Z Max |
| 3.5 inch Dia, 0.5 Inch thk Carbon rods with 1 rear rod and 2.5 Inch Polyurethane on end plates | 0.080 | 0.090 | 0.080 | 0.045 | -0.031 |
Follow the link for images and PDF result files. The new results can be observed at kalyan_23_May_08_2.3
Meeting on May 23 with Dr. Brian Williams and Kalyan Jinnuri
Tasks for next week
1. The aluminum casing around the end plates are to be modified (increase in size)
2. Triangular plates have to be attached at the corners where the endplate and back plate meet. This area becomes the constraint region.
3. The relative deformation in each end plate has to be less than 50 microns
6/3/08
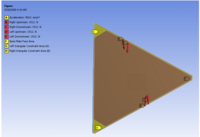
The aluminum casing width is increased by 30 mm, This increase is made on the upstream side between the aluminum slits and upstream side hole area, Triangular constraint areas were introduced to the geometry and the constraints were applied on them.
Sector 1 is studied under 6 cases of analysis.
- Case 1: Triangular Constraints are only in the downstream side and only upstream side on the nose plate
- Case 3: Triangular Constraints are only in the upstream side and only upstream side on the nose plate
- Case 5: Triangular Constraints are in both upstream and downstream side and only upstream side on the nose plate
- Case 2, Case 4, Case 6: are with both upstream and downstream side constraints on the nose plate for case 1, 3, 5 respectively
For Details, Follow the link for images and PDF result files. The new results can be observed at kalyan_30_May_08
Meeting on May 30 with Dr. Brian Williams and Kalyan Jinnuri
Tasks for next week
1. Double check the connections, refine and proceed to the next sector
2. Mylar sheet calculations in FEA and by hand
6/10/08 Mylar Analysis
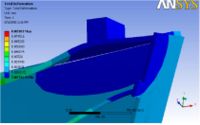
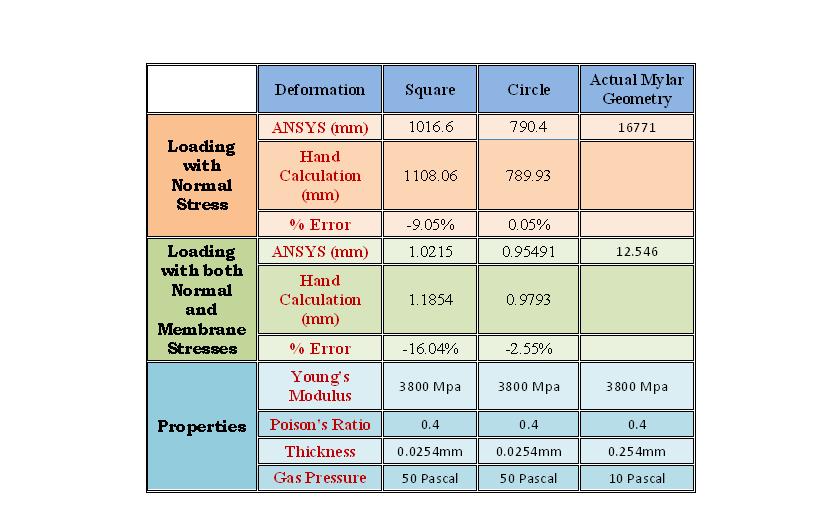
As shown below, ANSYS can't perform a calculation of the mylar deflection due to the small thickness to deflection ratio which occurs. If the mylar thickness is increase by a factor of 10 (form 1/1000 of an inch to 1/100), ANSYS would predict a deflection of about 12 mm. Formula do exist for simple geometries such as a square and a circle but not a triangle. A hand calculation for a square which is a factor of 40 smaller in size to R3 predicts 1/1000 inch thick rectangular mylar sheet will deflect about 1 mm and a circle a little less than 1 mm. If you assume the R3 triangle geometry to be similar to a 4 m x 4 m square , the mylar sheet would deflect 17.2 cm referencing manual calculations. The max error observed between manual result and ansys result was -16 percent with other sections and sizes. so expecting the deformation will be between 14.5 cm to 17.2 cm. 14.5 cm being the deflection after considering the error.
Our goal for next week is to produce a rough draft of the Detailed Design report which describes a design (either Case 2 or 6 above) that meets the R3 design goals.
We would like to ask the design to be frozen by July 4 so final production drawings can be completed by 9/22/08.
Introduction
The Mylar sheet on the upstream side of the Region III drift chamber was analyzed in ANSYS for FEA deformations and the results were justified by comparing with manual calculations.
Due to the fact that the Mylar sheet is extremely thin and week for FEA analysis and has complicated geometry to perform manual calculations, the analysis is slightly simplified.
• FEA analysis approach is justified by calculating the percentage error between FEA results and Hand Calculation results for some basic shapes with the actual thickness of 0.0254mm and the young’s modulus of 3800Mpa. A square sheet of 100 x 100 mm and a circular sheet of radius 50mm.
• The thickness of the Mylar sheet is increased from 0.0254mm to 0.254mm. This is done as ANSYS has a acceptable thickness to acceptable deformation ratio, with the specified thickness of 0.0254mm, the deformation is way over the deformation limit and ANSYS cannot handle the problem.
• For Very thin sheets like mylar, Large deflection membrane stiffened analysis is proven to be accurate and the same is otherwise termed as loading with normal and membrane stress approach and is detailed, Please follow the link Deformation with both Normal and Membrane Stress approach
Results
6/24/08
After attempting several cases with the upstream constraints, the deformation is at the hole regions and is observed to be about 100 microns for sector 1 in region 3. However, to limit the maximum deformation at the hole regions to 100 microns, several aspects have to be followed.
To obtain these results, these changes were made
• End plate thickness was altered
- The thickness of right end plate is increased to 3 inches from 2 inches.
- The aluminum casing around both the end plates and he back plate is 20mm
• Change of Carbon rods
- 7 carbon rods were used.
- Carbon rods counted from the bottom; rod 1, 2, 6, 7 are 2 inch outer diameter with 0.1 inch thick. However, rods 3, 4, 5 are 3 inch in diameters and 0.2 inch thick
• The wire orientation of the upstream wires are with a negative slant from left side to the right side
These above mentioned parameters change for every sector to limit the max deformation to 100 microns.
So, another approach to utilize the stiffness of the carbon rods was followed and gave better results
In this approach the carbon rods will be made slightly longer, such that after application of all the loads the effective deformation will be under the limit. To achieve this, a normal force equivalent to some extra length of the carbon rod is applied on the upper edges of the carbon rods which are the opposing forces for the deformation.
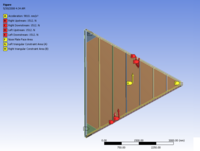
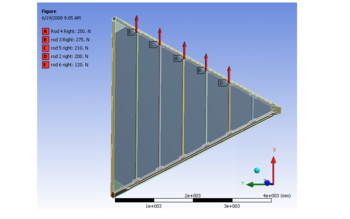
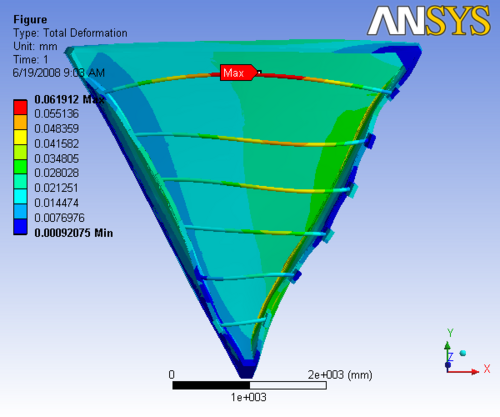
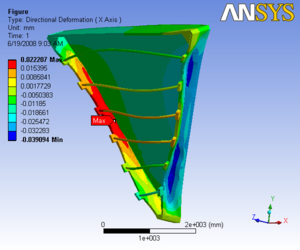
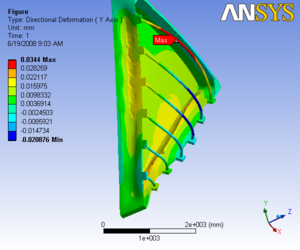
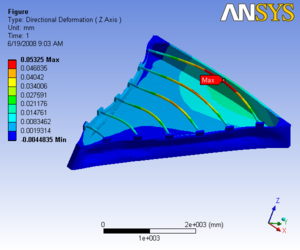
For sector 1, after applying 200N, 275N, 250N, 210N, 120N on carbon rods 2, 3, 4, 5, 6 respectively; the deformation dropped to 50 microns from about 130 microns.
The report generated by ANSYS is available: File:06.19.08slice1.pdf
|
 |
 |
|
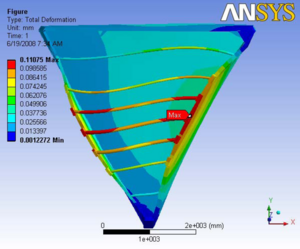
Figure: Images of Deflection for Sector 1 in D,X,Y,Z Directions respectively
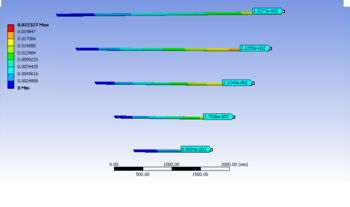
Now using these loads, which satisfied the deformation condition, those forces are transformed into equivalent linear lengths of the carbon rods. This is done by applying the same loads on just the carbon rods and find the linear deflections. Using ansys, the extra needed lengths of the carbon rods are as follows
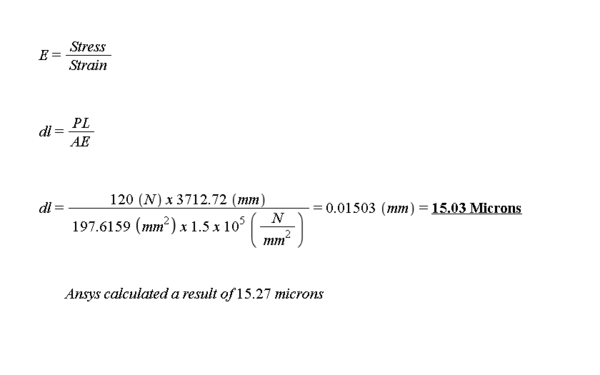
Extra length of the carbon Rod(6)
Length of Rod 6 (L)= 3712.72 mm
Applied load on the Rod 6 (P)= 120 N
Cross sectional area of the Carbon rod (A)= 197.6159 Sq.mm
Young's Modulus of Carbon fiber is 1.5 e 5 N/Sq.mm
Hooke's law
Young's Modulus (E)= Stress / Strain
Implies Change in length (dL)
Similarly all the remaining rod lengths are calculated and tabulated below
| Rod No. | Length (mm), L | Applied Load (N), P | Stiffness (N/mm), K | Deflection by Hand Calc (Micron) | Deflection by Ansys, (Micron) | Error% |
| 2 | 1201.07 | 200 | 24679.9824 | 8.2 | 8.5 | 3.59% |
| 3 | 1828.98 | 275 | 16207.0588 | 16.96 | 17.53 | 3.25% |
| 4 | 2457.12 | 250 | 12063.8741 | 20.72 | 21.21 | 2.31% |
| 5 | 3084.82 | 210 | 9609.1138 | 21.85 | 22.29 | 1.87% |
| 6 | 3084.82 | 120 | 7984.008 | 15.03 | 15.27 | 1.57% |
This extra length of the carbon rod can be achieved precisely by a measured mechanism.
