Difference between revisions of "EG1 Teleconferences DeltaDoverD"
| Line 85: | Line 85: | ||
;EC_tot/P_vs_Number_of_Photoelectrons and EC_inner/P_vs_Number_of_Photoelectrons | ;EC_tot/P_vs_Number_of_Photoelectrons and EC_inner/P_vs_Number_of_Photoelectrons | ||
| − | Two types of cuts were applied on the distributions below, one on the energy deposited to the inner calorimeter <math>EC_{inner}/P>0.08</math> and another one on the total energy absorbed by the calorimeter <math>EC_{tot}/P>0.2</math>, to improve the electron particle identification. In this case | + | Two types of cuts were applied on the distributions below, one on the energy deposited to the inner calorimeter <math>EC_{inner}/P>0.08</math> and another one on the total energy absorbed by the calorimeter <math>EC_{tot}/P>0.2</math>, to improve the electron particle identification. In this case we used the DST file dst27095_05, the beam energy is 5.735 GeV and target NH3.<br> |
{|border="2" colspan = "4" | {|border="2" colspan = "4" | ||
| Line 105: | Line 105: | ||
| − | From the EC_tot/P_vs_Number_of_Photoelectrons histogram one can see that the released energy fraction(<math>EC_{tot}/P</math>) at ~1.5 nphe peak is much smaller than it should be for electrons. In conclusion, the ~1.5 | + | From the EC_tot/P_vs_Number_of_Photoelectrons histogram one can see that the released energy fraction(<math>EC_{tot}/P</math>) at ~1.5 nphe peak is much smaller than it should be for electrons. In conclusion, the ~1.5 NPE peak is produced by the tail of negatively charged particles(pions). To eliminate negatively charged pions <math>EC_{tot}/P>0.2</math> cut is applied on Calorimeter. After the cut was applied the number of entries decreased by ~33.47%.<br> |
Revision as of 15:38, 29 January 2009
1/29/09
We are interested in measuring the semi-inclusive pion asymmetry for both proton and deuteron targets using the 5-6 GeV EG1b data set. Our goal will be to investigate fragmentation and establish a procedure for extracting within the CLAS 12 GeV program. We begin the analysis using the EG1 DSTs created from "cooked" data files. Our first goal is evaluate the cuts used by others to improved the identification of scattered electrons in the data sample.
Cherenkov signal
Cherenkov PE Calculation
As shown in the wiki section, Particle_Identification#Cherenkov,
the expected number of photoelectrons produced by electrons traversing the CLAS cherenkov detector would be
if you assume a of 1 for the detected electrons in our data sample.
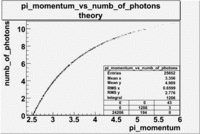
The expected number of photoelectrons in the CLAS cherenkov detector for reconstructed pion energies in the EG1 data set is shown in the graph below.
Our theoretical expectation, based on the description of the CLAS cherenkov detector suggests, that pions can generate up to about 10 photoelectrons compared with the 13 photoelectrons that can be generated by electrons. While the cherenkov detector can distinguish a 4 photoelectron signal generated by pions of momentum 3 GeV or less from the 10 photoelectrons generated by the typical detected electron, high momentum pions would generate photoelectron signals which are comparable to the photoelectrons generated by an electron.
Measured CLAS Cherenkov signal
Electrons
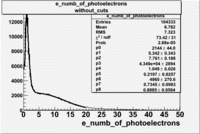
The cherenkov signal measured in CLAS for particles identified as electrons by the tracking algorithm is shown below. There are two distributions present. One distribution is centered around 0.7 PEs and the second distribution is at 5.3 PEs when two gaussians and a Landau distribution are combined and fit to the spectrum.
- PE Fit equation (Osipenko's CLAS Note 2004-20 File:CLAS Note-2004-020.pdf)
As we will show below, the first peak is due to the misidentification of a negative pion as an electron.
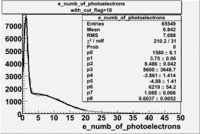
Reconstruction of an electrons trajectory through the CLAS drift chambers can be done using either 5 or 6 super layers. Do tracks reconstructed using 5 superlayers generate cherenkov signals which differ from tracks reconstructed using all 6 DC superlayers? The track reconstruction algorithm records the number of superlayers used for the track reconstructions. This number is recorder in the EG1 DST files within the "flag" variable. If the "flag" variable in the DST is larger than 10, then 6 superlayers were used for the track reconstruction. The cherenkov spectrum below is observed for particles identified as electrons in the EG1 data in which 6 superlayers have been used to determine their trajectory.
The table below compares the cherekov spectrum fit values for particles identified as electrons with and without the 6 superlayer requirement. If 6 superlayers are required for the electron reconstruction, the high PE gaussian distribution mean changes from 5.3 PEs to 3.8 PEs and is not not consistent within 2 standard deviations of the fit errors. The LOW PE gaussian distribution, the suspected pion contamination, mean changes from 0.7 to 1.0 PEs.
The cuts decreases the number of entries by 37.17 %. It is believed that the Gaussian distribution centered around 1 PE is due to high energy pions(>2.5GeV). Neither of these distributions is consistent with the theoretical predictions made above suggesintg that there are some light collection inefficiencies within the cherenkov detector.
Table: Cherenkov fit values
| Distributions | amplitude | mean | width | amplitude | mean | width |
|---|---|---|---|---|---|---|
| without cuts | with cut(flag>10) | |||||
| gauss(0) | p0=2144+/-44.0 | p1=5.342+/-0.343 | p2=7.761+/-0.188 | p0=1580+/-8.1 | p1=3.75+/-0.06 | p2=8.486+/-0.042 |
| landau(3) | p3=4.349e+04+/-2894 | p4=1.049+/-0.026 | p5=0.2197+/-0.0257 | p3=8600+/-3648.7 | p4=-3.861+/-1.414 | p5=-4.88+/-1.41 |
| gauss(6) | p6=4960+/-270.6 | p7=0.7345+/-0.0983 | p8=0.8885+/-0.0594 | p6=6219+/-54.2 | p7=1.088+/-0.006 | p8=0.6037+/-0.0052 |
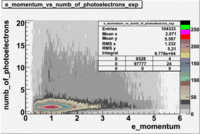
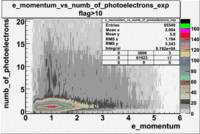
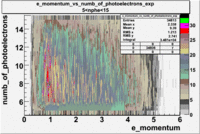
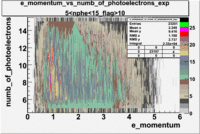
The plots below show the event population intensity as a function of the electron candidates momentum measured by tracking and the number of photoelectrons observed in the cherenkov detector
| Experiment | B>0 | without cuts | flag>10 | 5<nphe<15 | 5<nphe<15 and flag>10 |
|---|---|---|---|---|---|
|
|
|
|
Pions()
- _Momentum_vs_Number_of_Photons
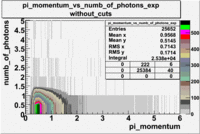
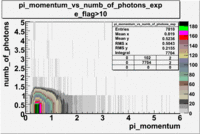
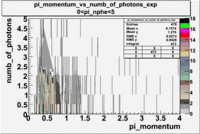
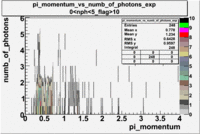
The histograms presented below show the event population intensity for the pion momentum and the number of photoelectrons generated by the pions. One can see that after applying cuts on NPhE and flag the mean value is around 1.
| Experiment | B>0 | without cuts | e_flag>10 | 0<e_nphe<5 | 0<nphe<5 and e_flag>10 |
|---|---|---|---|---|---|
|
|
|
|
Electron-pion contamination
Osipenko's CLAS Note 2004-20 File:CLAS Note-2004-020.pdf
- EC_tot/P_vs_Number_of_Photoelectrons and EC_inner/P_vs_Number_of_Photoelectrons
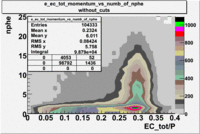
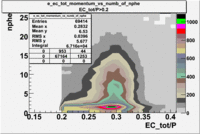
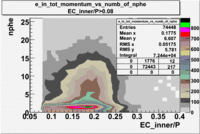
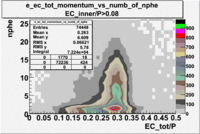
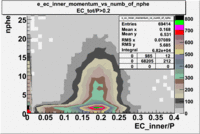
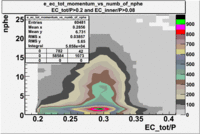
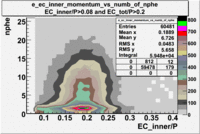
Two types of cuts were applied on the distributions below, one on the energy deposited to the inner calorimeter and another one on the total energy absorbed by the calorimeter , to improve the electron particle identification. In this case we used the DST file dst27095_05, the beam energy is 5.735 GeV and target NH3.
| without cut | _vs_nphe() | _vs_nphe () | _vs_nphe() |
|---|---|---|---|
|
|
|
|
| _vs_nphe() | _vs_nphe( and ) | _vs_nphe ( and ) |
|---|---|---|
|
|
|
From the EC_tot/P_vs_Number_of_Photoelectrons histogram one can see that the released energy fraction() at ~1.5 nphe peak is much smaller than it should be for electrons. In conclusion, the ~1.5 NPE peak is produced by the tail of negatively charged particles(pions). To eliminate negatively charged pions cut is applied on Calorimeter. After the cut was applied the number of entries decreased by ~33.47%.
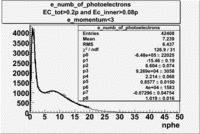
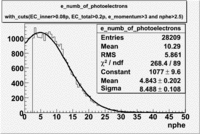
e_numb_of_photoelectrons with the following cuts , . To eliminate the photons produced by the negatively charged pions the cut on the momentum e_momentum<3 GeV was used. Because the high energy pions are able to produce photons, which are misidentified with photoelectrons generated by the electron candidates. These three cuts dont fully eliminate pion contamination. The peak around ~1.5 on nphe still exists. So the cut on number of photoelectrons was placed, in order to get rid off pion contamination in the sample. The mean value of the number of photoelectrons is ~10, which agrees with our theoretical calculation.
