Difference between revisions of "PAA Selenium/Soil Experiments"
Jump to navigation
Jump to search
| Line 2: | Line 2: | ||
{| border="3" cellpadding="5" cellspacing="0" | {| border="3" cellpadding="5" cellspacing="0" | ||
| Inventory # || Sample Description || Irradiation Conditions || Photon Spec History | | Inventory # || Sample Description || Irradiation Conditions || Photon Spec History | ||
| + | |- | ||
| + | | 170048 ||Soil + Se (10%) || [[LB_May_2017_Irradiation_Day#10.25_Se_Soil_Mix]] || | ||
|- | |- | ||
| 170067 ||Soil + Se || || | | 170067 ||Soil + Se || || | ||
| Line 7: | Line 9: | ||
| 170068 ||Sage brush Ash + Se || || | | 170068 ||Sage brush Ash + Se || || | ||
|} | |} | ||
| − | |||
=Runs= | =Runs= | ||
Revision as of 16:34, 26 May 2017
Selenium Sample Analysis
| Inventory # | Sample Description | Irradiation Conditions | Photon Spec History |
| 170048 | Soil + Se (10%) | LB_May_2017_Irradiation_Day#10.25_Se_Soil_Mix | |
| 170067 | Soil + Se | ||
| 170068 | Sage brush Ash + Se |
Runs
Jan 2016
March 2016
October 2016
Preliminary Information Before Irradiation of Soil Sample
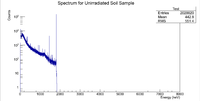
Using Detector D at the IAC, I had to get a count on the unirradiated soil sample that was collected. Here are the GPS coordinates ****
Here is the spectrum produced:
The details of the calibration along with the constants found from a linear fit of temperature vs. voltage can be found in the page below.
Calibration 10-21-16 Det D Calibration 10-28-16 Det A


