Difference between revisions of "HM 2014"
| Line 18: | Line 18: | ||
| 3.87 || 1000 || 2.87 || 8580 || 6579 || | | 3.87 || 1000 || 2.87 || 8580 || 6579 || | ||
|- | |- | ||
| − | | 3.87 || 1000 || 2.87 || | + | | 3.87 || 1000 || 2.87 || 8582 || 6581 || |
|} | |} | ||
Revision as of 04:11, 18 February 2015
02/17/15 QDC & PS-ADC measurements
each run lasted for 5 min. unless is mentioned differently
| cath (kV) | V_drift | V_GEM (kV) | open | closed | notes |
| 3.87 | 1000 | 2.87 | 8569 | 6570 | |
| 3.57 | 700 | 2.87 | 8572 | 8571 | QDC does not show a observed difference between open and closed shutter |
| 3.57 | 700 | 2.87 | 8573 | 8574 | |
| 3.87 | 1000 | 2.87 | 8576 | 6575 | |
| 3.87 | 1000 | 2.87 | 8578 | 6577 | |
| 3.87 | 1000 | 2.87 | 8580 | 6579 | |
| 3.87 | 1000 | 2.87 | 8582 | 6581 |
1/15/15
- Rate calculation (Shutter Open)
- SNR -vs- V
01/11/15 2.97kV GEM
cathode drift potential and count rate runs for 2.97kV GEM
cathode drift 1-1.1k potential and count rate runs for 2.87kV GEM
01/08/14 Peak shift with changing the GEM preamp. Voltage
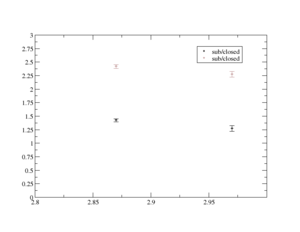
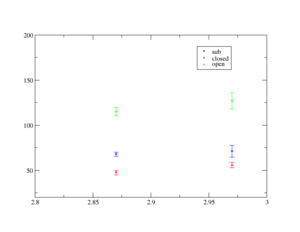
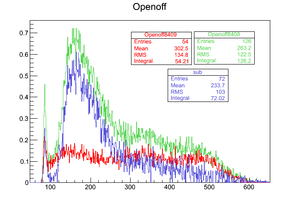
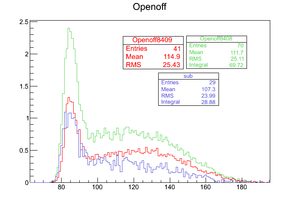
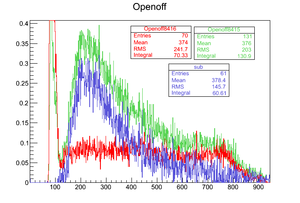
The ratio of signal to noise for each voltage is show below:
Even if the error bars looks small in the first figure that shows the sig./noi. and voltage of the GEM, it is noticed the error bars insect for the measurements of open shutter and the open-closed. So the error bars of the first figure can't tell if the increment of 100V for the GEM preamp's is really causing a change in the collected charge spectra.
12/31/14 Peak shift with changing the GEM preamp. Voltage
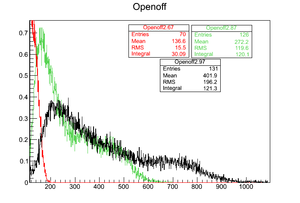
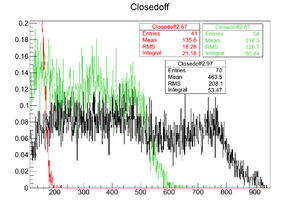
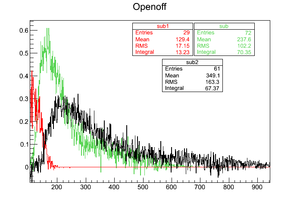
The following figures show the effect of opening and closing the shutter as the GEM voltage is 2.67, 2.87 and 2.97 kV.
The ratio of signal to noise for each voltage is show below:
You need to add error bars and make measurements at additional voltages
( measure for every 5 volts if error bars can tell the difference between each voltage)
It is noticed that increasing the voltage decreased the signal to noise ratio unless it is within the error bars, also increasing the voltage of the GEM from 2.87 to 2.97 kV does not affect the noise signal ratio, but it increases the charge detected which is expected as main characteristic for the GEM preamp. (results are same using both definitions of signal to noise ratio).
| V_GEM (kV) | open | closed | notes |
| 2.87 | 8479,8481, 8408 | 8480,8482,8409 | |
| 2.97 | 8484, 8486,8415 | 8483,8485,8416 |
12/30/14 Determining the noise level using pulse shape and peak sensing discrimination simultaneously
Using an AND-gate for a peak sensing discriminator and a leading edge one is used to determine the relationship between the discrimination level and the the signal rate.
Psensing spectra with an AND-gate output as a gate for the module
- Using LED only
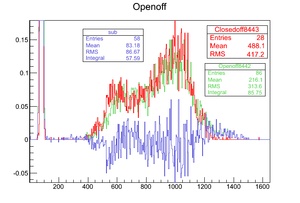
The LED disc. is used instead of the PS disc. to measure the Psensing charge spec., the following figure shows the result.
the signal is amplified so it is higher than the noise level, but still the LED disc. is unable to distinguish between open shutter and closed one.
the noise level is measured and it is 78 mV. (run 8445)
The counts near channel 100 suggest that the leading edge discriminator is not rejecting noise that we called a pedestal event.
12/27/14 Peak shift with changing the GEM preamp. Voltage
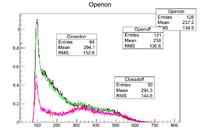
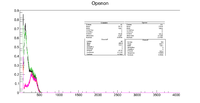
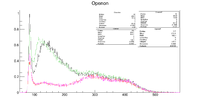
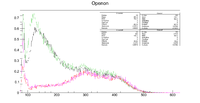
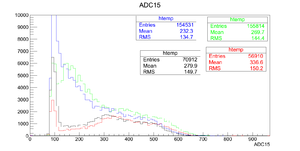
GEM3k peak sensing charge spectra
GEM3k peak sensing charge spectra
- GEM 2.87kV and cath. 3.47kV
- GEM 2.67 and cath. 3.27kV
- GEM 2.97 and cath. 3.57kV
12/24/14 Peak shift with changing the GEM preamp. Voltage
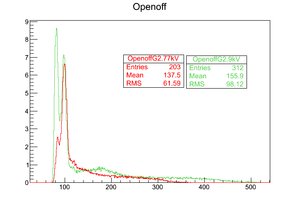
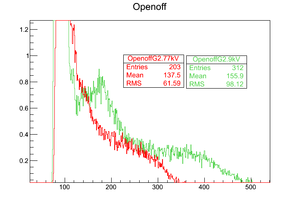
The following figure shows the peak shift in the Peak sensing charge spectrum as Drfit voltage is 700 V and the GEM voltage is changed as shown in the figure:
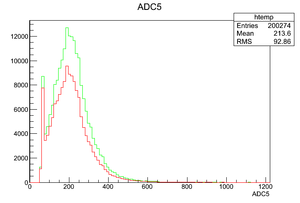
The figure above shows the peak shift as the GEM preamp. voltage is 2.77kV and 2.9kV. the higher voltage for the GEM preamp., the higher charge collected from the detector. Also the noise peak rate at channel is less at a higher GEM voltage.
12/24/14 GEM_V = 2.82 kV
cathode drift potential and count rate runs for 2.82kV GEM
12/18/14 Comparing increasing the GEM voltage 30 V to 2.9 KV
- GEM_V= 2.87 kV
- GEM_V= 2.9 kV
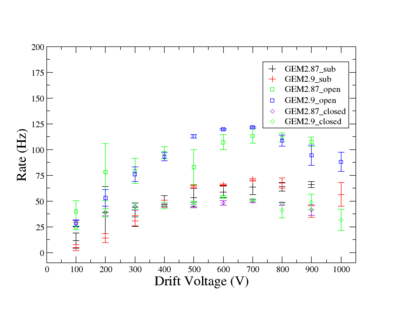
The results shows the integral under the charge spectra:
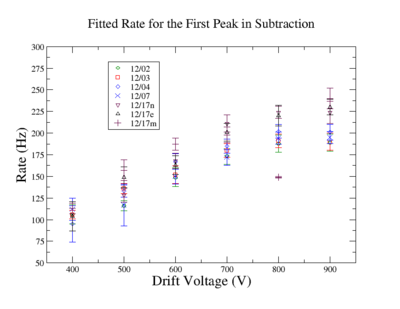
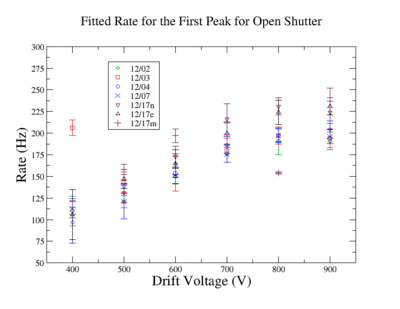
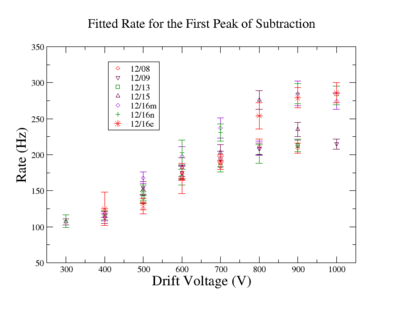
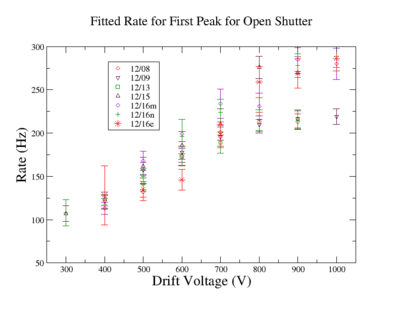
The maximum rate for the first peak in case of open shutter and in case of the subtraction is shown below:
- Notes
Increasing the the GEM voltage
- Increased the charge as the shutter is open as the drift voltage is in between 600-800V
- Increased the rate of the first peak rate, the rate at 800V and 900 V is not the same for all runs, the latest runs have higher rate, and the error bars are bigger for 800 and 900V.
- There is not any difference in maximum rate of the first peak for open shutter and the subtraction, so the shutter is completely stopping the charge flow to the anode as it is closed, even after the GEM's voltage increment.
- I will upload more graphs that have the average for each figure for the two values of the GEM voltages.
- 2.87 kV and 2.9 kV
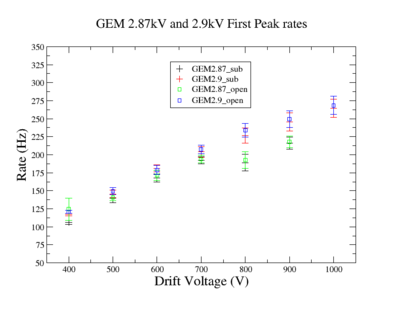
The figure above shows that increasing the GEM voltage with 30 V does not change the amount of charge except for the drift voltage in the range of 500 to 700 V (increase) and 900 to 1kV (decrease). The first peak rate in increases when the GEM voltage increases 30 V as the drfit voltage in the range of 300-900 V as shown below:
12/15/14
Data analysis,
File:12 2 3 4 count rate cathV.xls
12/11/14
you forgot to put possible reason for fluctuation in legend. Listing the possible reasons below is not informative
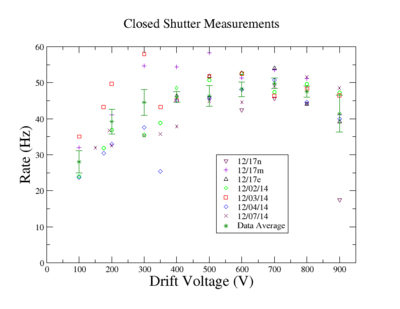
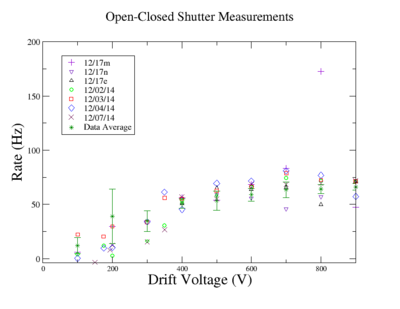
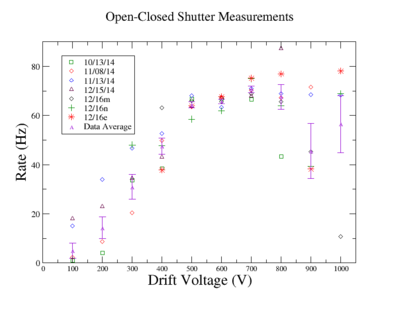
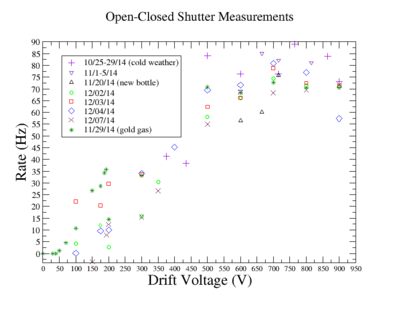
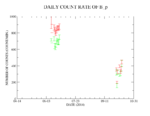
Figure 1.) Open-Closed data , from 10/25/14 -> 12/9/14, color code different days, legend indicates date and possible reason for fluctuations.
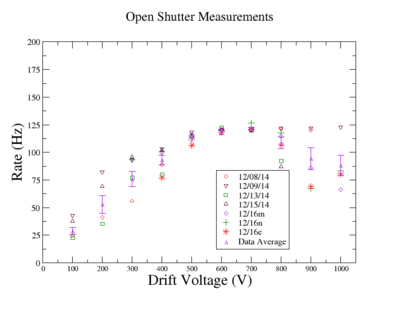
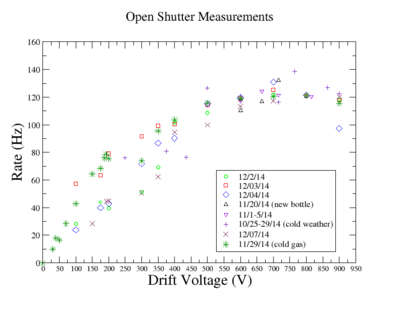
Figure 2.) Open data , from 10/25/14 -> 12/9/14, color code different days, legend indicates date and possible reason for fluctuations.
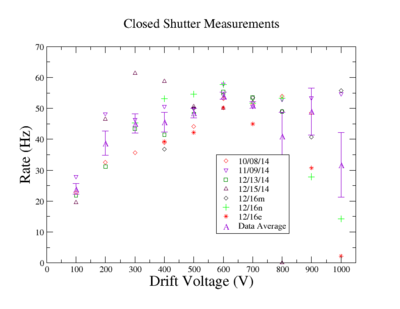
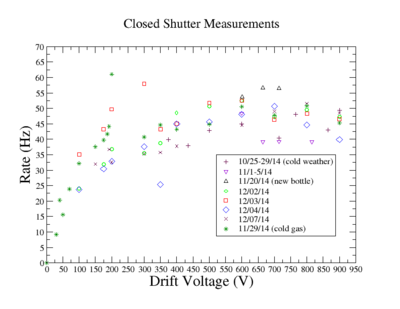
Figure 3.) Closed data , from 10/25/14 -> 12/9/14, color code different days, legend indicates date and possible reason for fluctuations.
- Fluctuations
- Changing the bottle twice.
- Weather temperature.
- Ar/CO2 gas' temperature was lower than the lab's temperature for the last bottle, a change is observed before and after the 11/20/14.
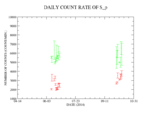
Figure 4.) Open-Closed data , from 10/9-present, color code different days, legend indicates date and possible reason for fluctuations.
Figure 5.) Open data , from 10/9-present, color code different days, legend indicates date and possible reason for fluctuations.
Figure 6.) Closed data , from 10/9-present, color code different days, legend indicates date and possible reason for fluctuations.
- The effect of the drift field
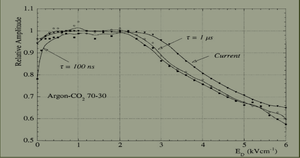
File:Laura De Nardo, Marchiori Elena, PhD thesis,Università degli studi di Padova, 2013/2014
There is an effect for the drift potential on the count rate as its value is less than 0.4 kV, one of the reasons that the drift force line ends on the surface of the GEM electrode, on the other hand, when the drift more than 0.4 kV, the drift force lines converge inside the hole.
Another reason is in case of the drift potential is more than 0.4 kV, the probability of electron-ion recombination before the GEM electrode is less compared to the case when the drift potential is less than 0.4 kV.
If the electric field is higher than 0.8 kV, the electric filed lines end on the surface, and the ones in the holes do not converge as much as in the case of of V_drift =< 0.8 kV, which cause an electron defacusing effect.
File:Bachmann GEM charge transcfer properties driftE.pdf
12/10/14
Three figures
Figure 1.) Open-Closed data , from 10/25/14 -> 12/9/14, color code different days, legend indicates date and possible reason for fluctuations.
Figure 2.) Open data , from 10/25/14 -> 12/9/14, color code different days, legend indicates date and possible reason for fluctuations.
Figure 3.) Closed data , from 10/25/14 -> 12/9/14, color code different days, legend indicates date and possible reason for fluctuations.
Figure 4.) Open-Closed data , from 10/9-present, color code different days, legend indicates date and possible reason for fluctuations.
Figure 5.) Open data , from 10/9-present, color code different days, legend indicates date and possible reason for fluctuations.
Figure 6.) Closed data , from 10/9-present, color code different days, legend indicates date and possible reason for fluctuations.
Figure 7.) Overlay average of 10/25/14-> 12/9/10 measurements and average of 10/9-present, legend indicated GEM voltage,
12/09/14
- Reference for number pf counts vs the cathode voltage
12/08/14 2.9kV GEM
cathode drift potential and count rate runs for 2.9kV GEM
12/08/14
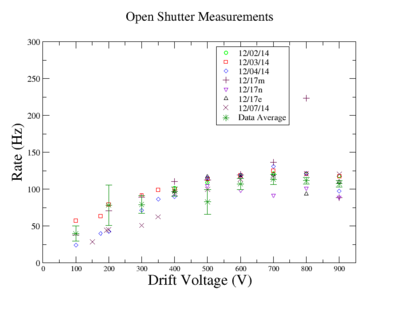
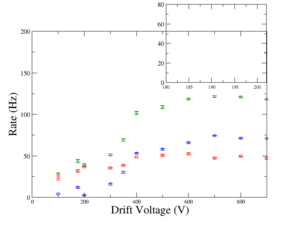
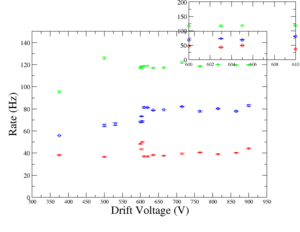
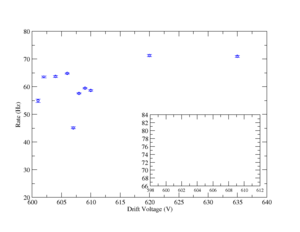
The figure shows the drift voltage vs the count rate in another weekend.
The graph is different from the graph taken by the previous weekend 11/29/14 as the drift potential is less than 350 V. as shown below
Investigate ionized electron transmission by looking at previous published studies of Cathode voltage differences.
12/05/14
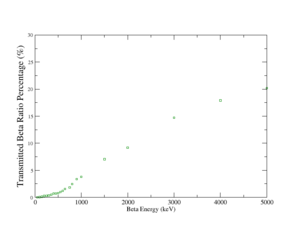
- Beta Transmission ratio percentage in FR4
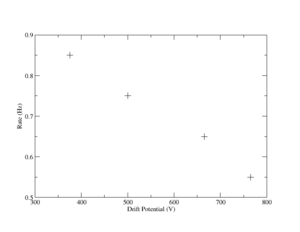
The figure below shows the number of beta transmitted through 1 mm FR4, the collected data considers only the incident beta only without counting for primary electrons as result of the ionization through the shutter and without electron ionization in the gas in the drift volume.
- Cathode vs Count Rate
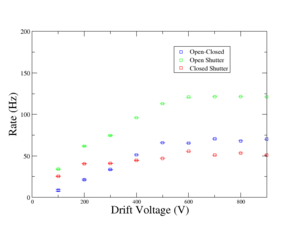
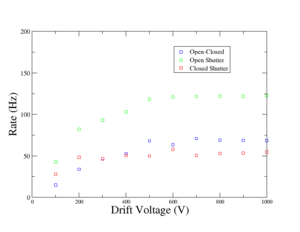
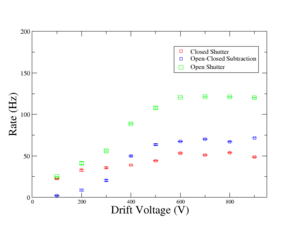
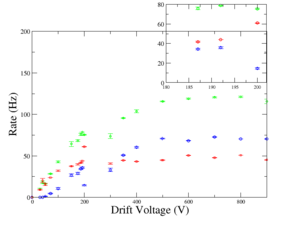
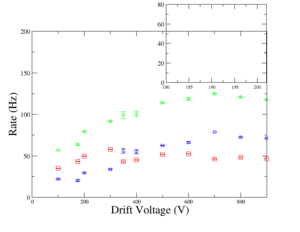
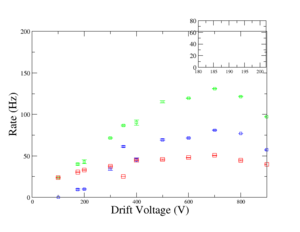
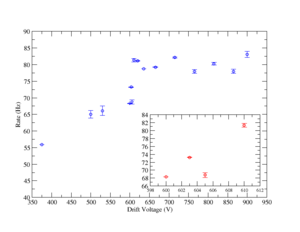
The figure shows the count rate as the shutter is open (green), closed (red), and their subtraction (blue) as the drift voltage changes. The measurements were taken in the weekend.
The figures above show the count rate in three different working days, the color refernce is as the figure above.
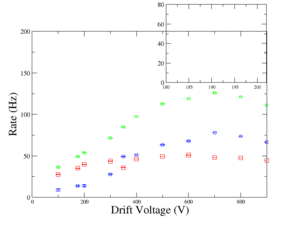 File:12 2 3 4 count rate cathV.xls
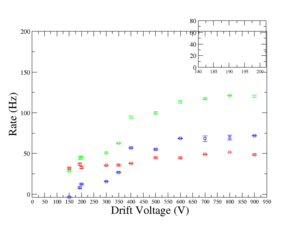
The average of previous of the data for the three figures above is calculated with the error bars.
Notes:
- As mentioned below, as the drift potential is between 400-900V, the same count rate is measured in average for the the three cases.
- The count rate increase between 193V and 200V was not observed.
- As the voltage is 900V, in all days, a high noise is observed for shutter open. It confirms what we discussed before; it indicates a need for more amplification and a higher discrimination level if we are interested in determining the full charge spectrum from U-233.
- Another set of measurements will be taken this weekend to reproduce the graph for 11/29.
12/01/14
The figure shows the drift voltage effect on the number of counts for shutter open (green), closed (red), and their subtraction (blue)
I noticed:
- There is not any effect for increasing the cathode voltage when the drift voltage is 400V or higher.
- The count rate is doubled between as the drift voltage changes from 193V to 200V.
- Compared to the previous graph (measurements before 11/20/14) a shift in the voltage for the area that number of count rate dramatically increased, it changed from around 600V to 200V. Also the count rate decreased with about 10Hz (only for the subtraction graph in blue) after changing the old bottle.
- The data are measured in the weekend, and it would be measured again through the normal working days to compare the results.
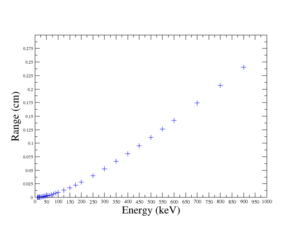
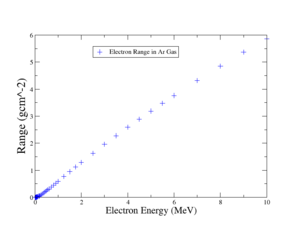
11/29/14 Electron range in FR4
The calculations considers the excitation energy for FR4 equals to 107.1 eV.[2], and composite is from the site [3]
11/25
11/03-19 Ionization calculations
File:Total ionization 3particles.xls
11/20/14
A difference in the number is noticed after changing to the new bottle!!!!!
10/27/14
Plot V -vs- R
The V -vs- R graph seems to be jumping around a lot.
This may mean we need more measurements in order to determine if there is a smooth dependence or not
- Ar ionization cross section
The energy is in the unit of MeV/amu which is relative to the atomic mass unit of hte target. In our case we are interested in Ar which has an amu = 40.
10/24/14
Table of Histograms with NO SOURCE, shutter open and closed, and changing V cathode
(750 Volts)
Plot the rate of all three particles from source onto one plot
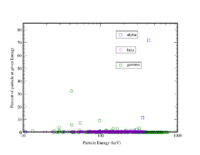 File:U-33 SourceParticlePercentage.xmgrace.txt
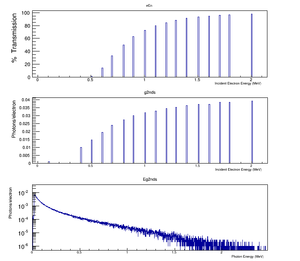
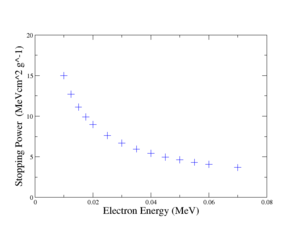
Electron energy threshold to penetrate 1mm thick FR4, and the energy for full penetration.
Plot transmission by taking ratio of (Number particle through shutter)/(Number of particles hitting shutter)
Plot Energy loss ( 100 *)
10/23/14
Table of Histograms with NO SOURCE, shutter open and closed, and changing V cathode
10/22/14
Long run peak sensing histograms
20min run peak sensing histograms
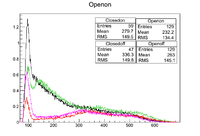
20 min. GEM-2.87 kV CATH-3.435 kV 10/17/14
you need to label the axis and color code the statistics box so I know which distribution corresponds to which configuration.
10/16/14
you need to label these histograms with more detail that will identify the run number and the run conditions.
Name each histogram according to the run number then in a figure caption identify the run conditions.
you need to show more than just 4 runs, try to take 10, why is the pedestal peak different in the four that you show.
You need to have units of Hz for the count rate on the y-axis.
I should not be asking you for the above things at this stage of your career, you should be doing hem automatically
I am not giving any formal results yet since the voltage of the GEM may increase.
The point is to able to understand what is plotted and have a reference to fall back on
Formal results will be even more detailed
- Last update for the today's measurements
- Reproduciblity is achieved when for the peak sensing spectra for shutter open and shutter close without source.
- Increasing the GEm amplification is needed for the case of the shutter open with the source on.
Analyze all runs with same conditions of HV, Gas, … to determine the integral number of counts in the ADC(PADC) histogram that are above the pedestal.
10/14-15/14
| Shutter | run numbers | average number of counts above the pedestal |
| Open | 7797, 7802, 7808, 7816 | 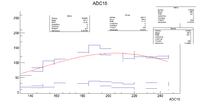 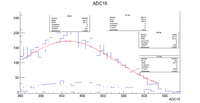
|
| Closed | 7798, 7803, 7809, 7817 | 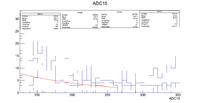 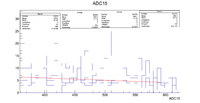
|
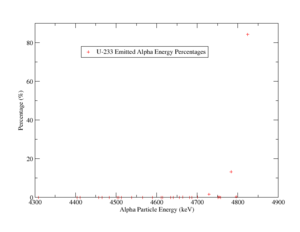
Fix the percentage plot for the number of betas emitted by the source.
The repcentages do not add to 100% according to two different references.[4][5] they add to about 20%, the first referece bentioned that the average energy for the emitted particles from U-233 are
Ebeta (eV) : 5.043230e+3 (5.363190e+2)
Egamma (eV) : 1.110210e+3 (1.076780e+2)
Ealpha (eV) : 4.888350e+6 (2.896760e+4)
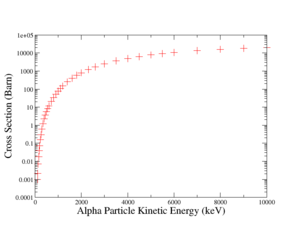
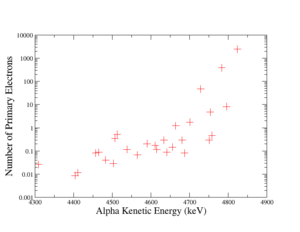
Fix the alpha log plot for cross-section, change units on the beta plot for cross section so they are in barns.
Add plot for expected voltage on oscilloscope.
| Alpha | 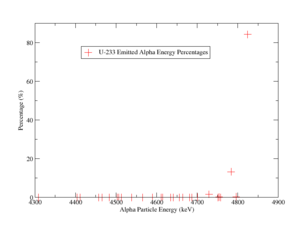 |
 |
|
| Beta | 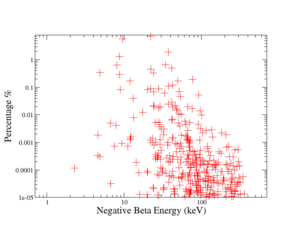 |
 [6] [6] |
|
| Gamma | 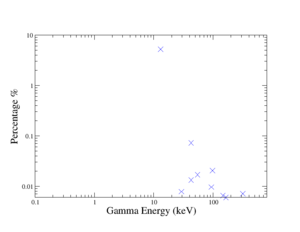 |
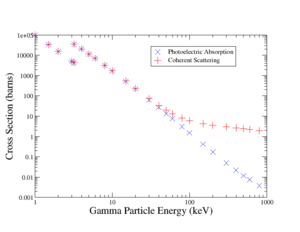 |
300 px |
10/13/14
stripchart
- Relationship between barns and g/cm^2
paragraph describing percentage plots for alpha, beta, and gamma with references.
| long run | time | shutter | source | Notes |
| 7832 | 6h | open | off | 8dB |
| 7834 | 35min | closed | off | 8dB |
| 7836 | 5.5h | open | on | 11 dB |
10/10/14
10/02/14
QDC's and Peak sensing's spectra distinguish between shutter open and shutter close as the source is on, I noticed it from yesterday's and today's measurements.
Also the spectra shows a difference in the number of count and the number of channels as the source on or off as the shutter is open. more measurements is needed to calculate the STDEV.
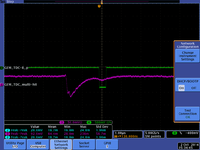
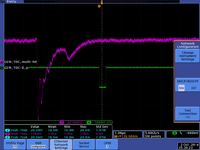
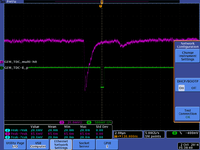
The oscilloscope picture is shows the gate and signal details,
| date | time run ended | Source | run number | notes |
| 10/02/14 | 10:45 | On | 7792 | each run time is 20 min. |
| 10/02/14 | 11:07 | off | 7793 | 22', taking the source off directly then measuring the charge does not show any difference in channel number but shows difference in counts. |
| 10/02/14 | 16:30 | off | 7795 | 20', after 5 1/2 h the detector started to show a little difference again between shutter open source is on and when the source is off. |
| 10/03/14 | 8:00 | off | 7795 | 20' |
| 10/03/14 | 11:21 | off | 7795 | 20' equilibrium without source. |
| 10/06/14 | 09:05 | off | 7802 | 20' equilibrium without source. |
| 10/07/14 | 7:00 | off | 7806 | lower charge is detected |
| 10/07/14 | 11:19 | off | 7807 | higher charge is detected (TSO's stuff were checking on the source) |
GEM_HV= 2870 Volts, Drift HV = 3470 Volts
09/30/14
Plot of shutter open/closed (NO SOURCE) counter rate -vs- date
- Alpha's Primaries
Plot of Number of electrons collected -vs- Energy of (alpha, beta, and gamma) from U-233
- Electrons


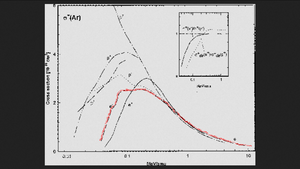 [K Paludan et al 1997 J. Phys. B: At. Mol. Opt. Phys. 30 L581 doi:10.1088/0953-4075/30/17/005
]
- Gamma
09/29/14
- Shutter open/close data plot for 2.87 3.48 kV GEM /Cathode
[7] The reference gives percentages of the emitted alpha particles as U-233 -> Th229 File:Alpha percentages.txt
- Roy's detector infomation and measurements
U-233 metal deposited source is measured by Protean Instrument corporation gaseous detector, has a model number of WPC9450 (serial number: 0915723)and uses (P10) gas mixture, as shown below:
| Shutter position | Alpha particles /min. | Beta particles /min. |
| Open | 6879 | 900 |
| Close | 1 | 38 |
- 09/20/14
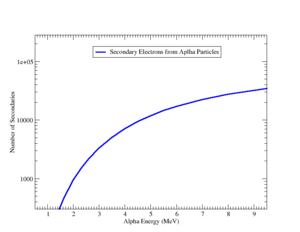
Rate of ( alpha, photon, beta) -vs- energy for U-233
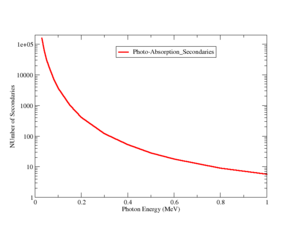
Primary electron ionization -vs- (alpha,photon, beta) energy
- Alpha Secondaries
- Photo-Absorption Secondaries
The reason that the graph started from 30 keV is the lowest gamma energy emitted by U-233 or Cf-252 is higher than that energy.
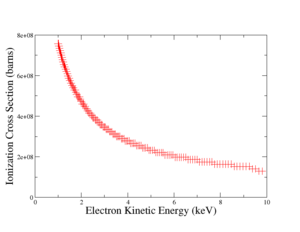
- Electron Ionization
Using NIST data base [8]
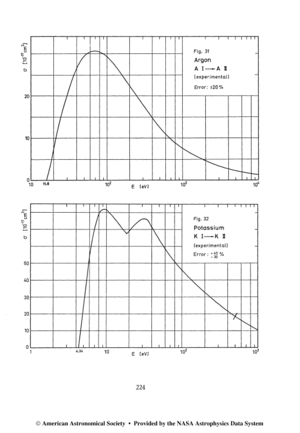
we got the following data file for CO2 File:CO2 e ionization xsection.txt, For Ar, the ref. [9] that measured the ionization xsection. ![]()
![]()
09/20/14
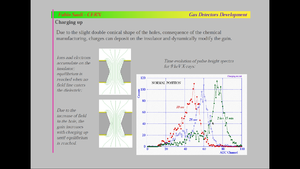
The figure below shows the change in the signal as the GEM capacitor charges, at a specific fixed voltage it reaches saturation (equilibrium),
If the capacitor does not reach equilibrium, the signal of the detector is expected to change with time.
What may forbid the GEM capacitor to reach the equilibrium?
- The circuit board voltage fluctuations.
- The following reference describes almost the same conditions as those of our detector when their detector is in operation to detect simultaneously photons with alpha particles.
Nuclear Instruments and Methods in Physics Research A 471 (2001) 151–155
File:Gas electron multiplier for portal imaging wallmark.pdf
The author commented in the conclusion "The studies show that GEMs can operate at extremely high rates (>10^6 Hz/mm^2) with no sign of degradation and stability loss due to radiation damage. However, it was discovered that the maximum achievable gain for all planar gaseous detectors drops with the beam intensity "
"In real clinical operation the detector can operate safely with a gain of 10^2 in the GEM closest to the collector".
Our detector has a rate of 100-170 Hz (without and with the source), considering the detector age, will this rate cause an instability?
- High detector rate.
The gain will decrease when the count rate increases, if GEMs' voltage is at the point where gain is stable with the high rate, the detector output will be reproducible. As mentioned above, a gain of 10^2 made it enough for imaging with a well-quenched gas, I doubt we need to increase the gain more than that.
9/18/14
Determine best Cathode HV that produces the largest separation of the source ON/OFF signal.
The detector results are not reproducible, as the voltage is at 3.4 kV, the QDC spectrum is different as the source on; so QDC can not distinguish if the source is on or when it is off the detector.
Something is wrong!!!!
We never have a reproducibility problem before using the QDC until I start using V1495, Can we borrow the older module just to test the reproducibility is still a problem.
It is very unlikely that it is the v1495.  The V1495 only tells the DAQ to read out a module.
You can test the DAQ by injecting a pulse with a known charge and look for it in the QDC spectrum.
It is VERY important to have scope pictures showing the difference between source ON/OFF.
Then you use scalers to check that your trigger pulse is able to see a difference between source ON/OFF
Then you do the DAQ measurements.
If you don't follow the above proceedure then you will be building a pyramid on quicksand.
The same case when the cathode voltage increased to 3.6 kV.
Then perform a set of measurements (shutter open/closed and source ON/OFF) to establish reproduceability. Make sure you record the scaler count rates.
9/17/14
Measure the charge for several values of the Cathode HV keeping the GEM preamplifier voltage and gas flow rate constant.
- CATH 3.2 KV
- CATH 3.1 KV
All the runs have the same duration 20 min.
- CATH 3.4 KV
Try to take scope picture to show difference between source on and off signal that are being measured by the QDC.
9/16/14
- Condition of above results
Shutter is Open
Red is Cf-252 source ON Run 7724
Green is Cf-252 source OFF run 7726
HV_GEM= -2930 Volts HV_Cathode=-3400 Volts
Gas Flow rate = 0.1 ft^3/hr
- Goal
- Can the Cf-252 source ON signal be changed?
Change the Cathode voltage to try and turn off the signal when the source is on.
- Result
Yes, when the cathode voltage is decreased to -3100V, QDC histogram does not show any difference in the collected charge as the shutter is open with the source on it, and when the shutter is open without the source.
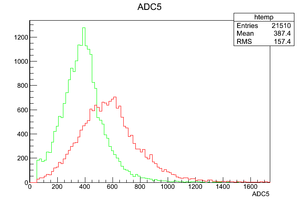
The figure below shows the change in the QDC spectrum when the cathode voltage is -3.2 kV.
