Trash
12-12-08
Finding out what is gain for each channel using the Stanford pulse generator.
Setting:
Run Number: r634 && r635
Original pulse from stanford pulse generator goes to the ADC: r636 && r637
I used the attenuator for both channels and it was set to the same value: 12dB = 10.7918.
Gain Calculation
Gain_for_Channel_1 = Gain_TrigOut =
Gain_for_Channel_5 = Gain_Strip =
TrigOut and the stripsignal, both are used as a pulse and go to ADC.
The pulse from the Strips is used as a trigger and gate.
The pulse from the trigout is delayed, Amplified by the Timinig Filter Amplifier(Coarse_Gain=X20, Fine_Gain=8.5 && Integrate=20ns).
Signal from the Strips goes to the Timing Filter Amplifier(Coarse_Gain=X20, Fine_Gain=10.5 && Integrate=20ns). Amplified pulse is devided into two signals, One is sued as a trigger and gate and second as a pulse for ADC. The first one(gate && trigger) is amplified using the Timing Filter Amplifier(Coarse_Gain=X2, Fine_Gain=10 && Integrate=50ns) and used in DIFF. CFD for gate and trigger. Second output from the Amplified strips, goes to delay box(TENNELEC TC 215 DELAY AMPLIFIER) and putted to the ADC.
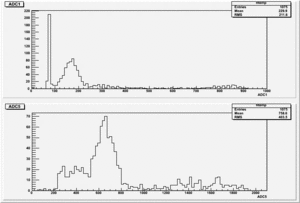
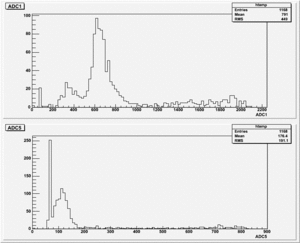
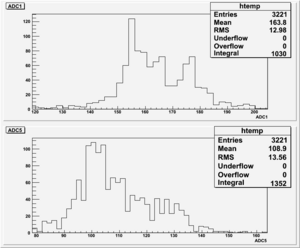
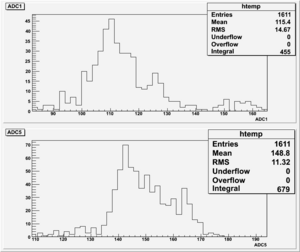
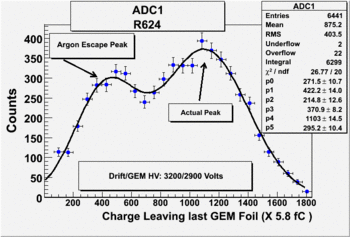
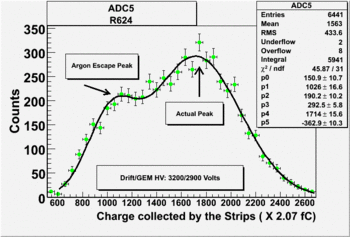
The results shown below are for different Diff. CFD values.
1). Threshold Values: Threshold=1.90, ULD=9.65 && LLD=2.10
Run Number is r613
Start time: Dec 11 16:31:42 End Time: Dec 11 17:32:23
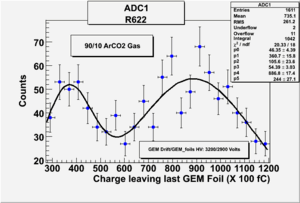
2). Threshold Values: Threshold=3.10, ULD=9.65 && LLD=2.90
Run Number is r622
Start time: Dec 11 19:25:28 End Time: Dec 11 21:53:44
2). Threshold Values: Threshold=3.70, ULD=9.65 && LLD=3.50
Run Number is r624
Start time: Dec 11 21:58:37 End Time: Dec 12 12:19:53
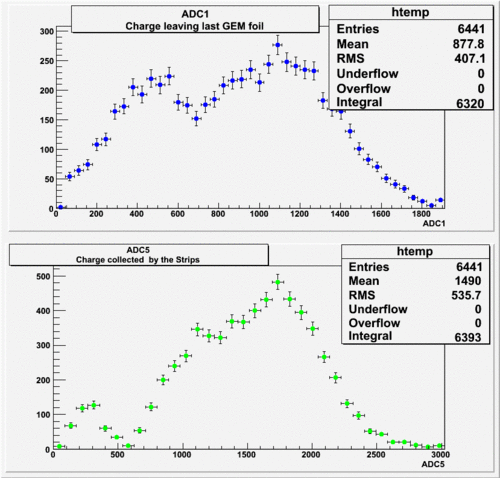
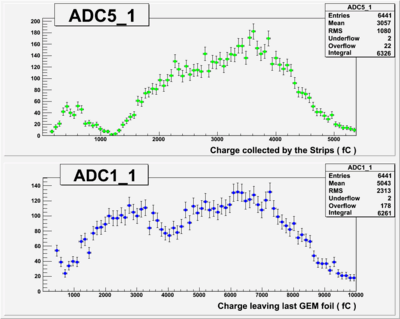
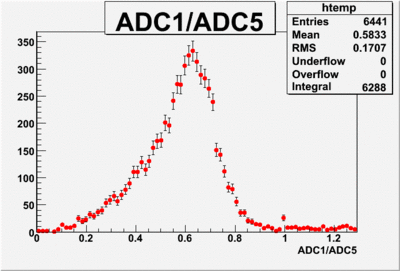
The result shown below is reasonable. The charge that left the last GEM foil is greater than the charge collected by the strips.
QCD and asymptotic freedom
In non-Abelian gauge theories, the beta function can be negative, as first found by Frank Wilczek, David Politzer and David Gross. An example of this is the beta-function for Quantum Chromodynamics (QCD), and as a result the QCD coupling decreases at high energies.
Furthermore, the coupling decreases logarithmically, a phenomenon known as asymptotic freedom. The coupling decreases approximately as
where β0 is a constant computed by Wilczek, Gross and Politzer.
Conversely, the coupling increases with decreasing energy. This means that the coupling becomes large at low energies, and one can no longer rely on Perturbation theory.
Thesis
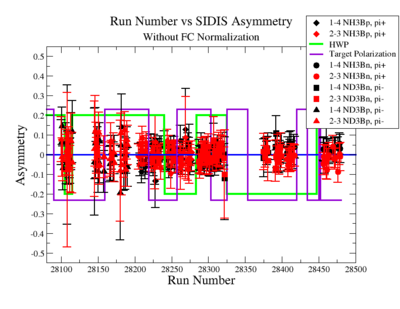
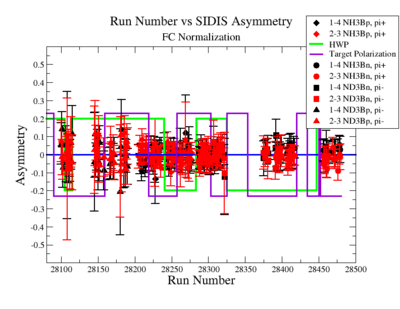
The SIDIS asymmetries for each target type, hadron type and run number ( and ) are shown on Fig. 2.17 before and after FC normalization:
|
Figure 2.17. Run Number vs Semi inclusive asymmetry before and after FC Normalization. |
unless the runs can be combined to show sign changes like in figure 2.16, this plot may not be too useful given the table below
You might try doing the above plot with only the pi+ asymmetries
The electron asymmetries for each target type, before and after FC normalization are listed in Table 4.2.
| Run Group | Target Type | Before FC | After FC |
| ND3 | |||
| NH3 | |||
| Table 4.2. Electron Asymmetries for NH3 and ND3 targets before and after FC Normalization . |
Maybe I don't understand the above table, but Figure 2.16 clearly shows non-zero asymmetries while the uncertainties in the above table indicate that everything is zero.
Current quark
Radiative corrections
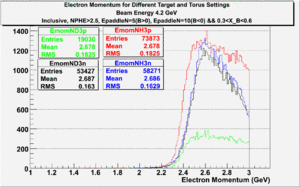
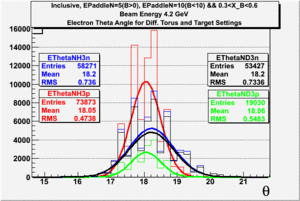
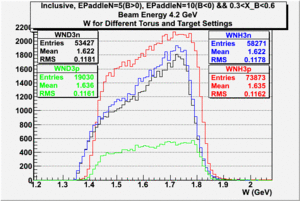
The electron efficiency of individual scintillator detectors using the 4.2 GeV data for ND3 and NH3 targets is described below. In the final state, only electron detection was required(inclusive case). The contamination in the electron sample was removed by applying cuts described in the first chapter. The electron paddle number 10 (B<0) and 5 (B>0) were chosen respectively because they contained the most electron events in a first pass semi-inclusive pion analysis of the data set. The electron kinematics(Momentum, scattering angle and invariant mass) for these scintillators is shown on Fig. 3.1.
 |
 |
|
| Electron Momentum((NH3,B>0), (NH3,B<0), (ND3,B>0) && (ND3,B<0)) | Electron Scattering Angle ((NH3,B>0), (NH3,B<0), (ND3,B>0) && (ND3,B<0)) | W Invariant mass((NH3,B>0), (NH3,B<0), (ND3,B>0) && (ND3,B<0)) |
Figure 3.1. Electron Kinematics.
The goal of this thesis is to measure the semi-inclusive asymmetry when an electron and one pion are detected in the final state. This asymmetry may be written in terms of ratios of charged pion production cross sections from proton and neutron targets sorted according to the orientation of the incident electron helicity with respect to the target's polarization. Pions of opposite charge will be observed using the same scintillator by flipping the CLAS Torus magnetic field direction. Although the pions will be detected by the same detector elements, the electrons will intersect different detector elements. As a result, the electron efficiency will need to be evaluated in terms of the electron rate observed in two different scintillators detecting the same electron kinematics. The two scintillators are defined according to the polarity of the CLAS torus.
The ratio of the number of electrons weighted by the faraday cup for two different cases are following:
The ratios were taken for different types of target, so that we could compare the results to MAID 2007 Model. In order to make detector efficiency the same for two different cases (ND3,B>0 && NH3,B<0) and (ND3,B<0 && NH3,B>0), the ratios have been adjusted so that it equals to one. Each of the two cases are multiplied by so called, "correction coefficient". The coefficient for the case is and for the it is .
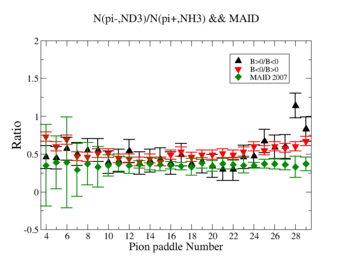
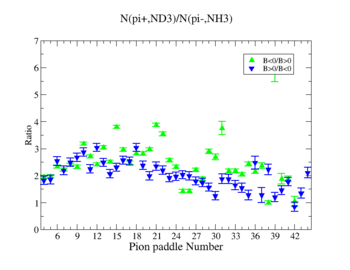
In this chapter we discuss the pion efficiency in semi-inclusive case. The ratio of the pions detected in the scintillator paddles, located between the Cherenkov counter and electromagnetic calorimeter, is shown on Fig. 4.1. The ratios were taken for four different cases. Assuming that, for the inbending case positive pions and for the outbending case have the same trajectories(the same kinematics) and vice versa((the inbending,negative pion) and (the outbending, positive pions)).
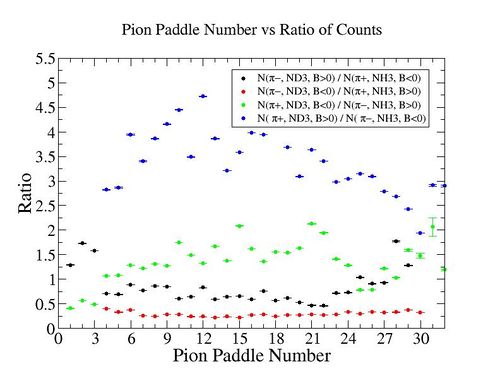
Figure 4.1. Pion paddle number vs Ratio.
We used MAID 2007 model to compare our results. Total cross section was calculated for the following invariant mass and four momentum transferred square: and . <ref name="MAID2007" > http://wwwkph.kph.uni-mainz.de/MAID//maid2007/maid2007.html</ref>. After applying correction coefficients from inclusive cases, the ratios have been compared to the results from MAID2007.
After applying correction coefficients from inclusive cases, the ratios have been compared to the results from MAID2007.
Figure 4.2. Pion paddle number vs Ratio after correction.
Applied corrections are following:
