Tamar ResultsChapt
Results
The final results are presented in this section. They have been obtained by analyzing the data collected in 2000 - 2001 at Thomas Jefferson National Laboratory using a longitudinally polarized electron beam on a longitudinally polarized Hydrogen (NH) and Deuterium (ND) targets. The incident electron's energy was 4.2 GeV. The CEBAF Large Acceptance Spectrometer (CLAS) was used for particle detection. The measurements were made for the kinematic region where and momentum transferred squared between 0.9 and 1.3 GeV. The SIDIS asymmetries were measured for four different values of .
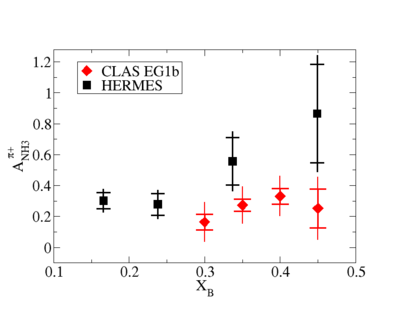
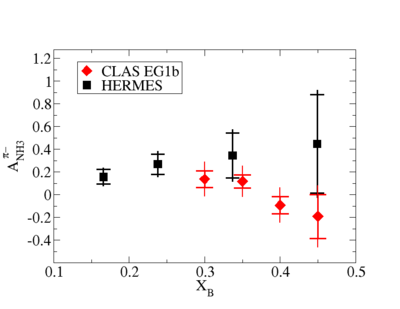
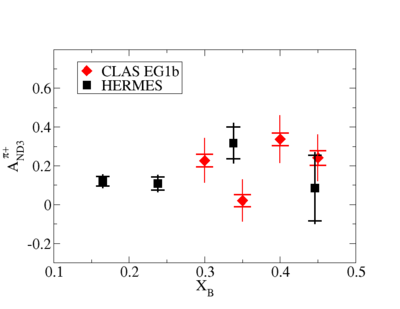
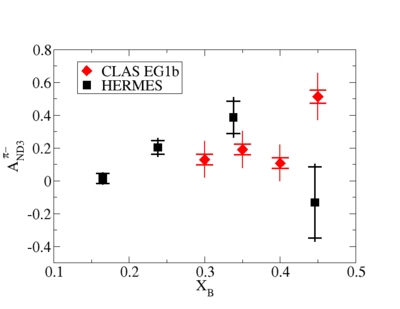
The corrected measured semi-inclusive deep inelastic asymmetries , , and are shown below on Figures~\ref{fig:AsymNH3Pos}, \ref{fig:AsymNH3Neg}, \ref{fig:AsymND3Pos} and \ref{fig:AsymND3Neg} respectively and compared to the asymmetries measured by the HERMES experiment. The measured SIDIS asymmetries on the proton and deuterium targets are in good agreement within their combined uncertainties. The SIDIS asymmetries for longitudinally polarized Hydrogen (NH) and Deuterium (ND) targets are listed in Table~\ref{tab:SIDISActualAsymNH3} for four values of . The asymmetries have been corrected for the target and beam polarization \cite{Dharmawardane2006} and dilution factor from ref\cite{Bosted}.
| 0.30 | ||
| 0.35 | ||
| 0.40 | ||
| 0.45 | ||
| 0.30 | ||
| 0.35 | ||
| 0.40 | ||
| 0.45 |
| Semi-inclusive asymmetries on the proton and deuterium targets ( and ). |

|
| versus SIDIS Asymmetry. The solid black squares are measurements from ref\cite{Airapetian} and the solid red diamonds represent SIDIS asymmetries measured using the data collected during the EG1b experiment. The error bar lines represent statistical uncertainty and the risers systematic uncertainty. |