Difference between revisions of "Spectra Analysis"
Jump to navigation
Jump to search
| Line 34: | Line 34: | ||
;conclusion | ;conclusion | ||
| − | : The above neutron rate from each of the above targets is statistically the same. | + | : The above neutron rate from each of the above targets is statistically the same and two standard deviations above zero. |
== Graphs for Neutron analysis == | == Graphs for Neutron analysis == | ||
Latest revision as of 03:22, 22 April 2009
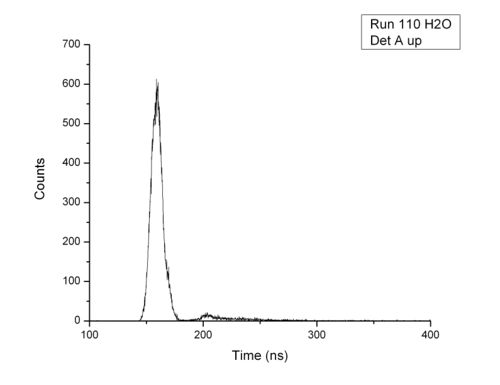
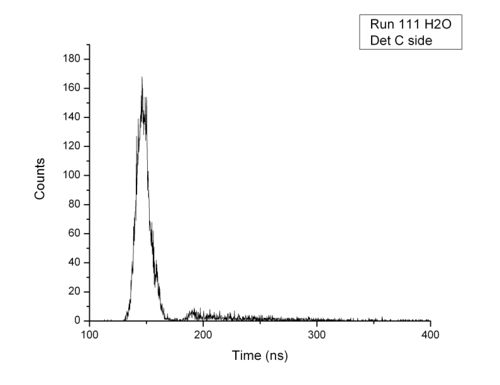
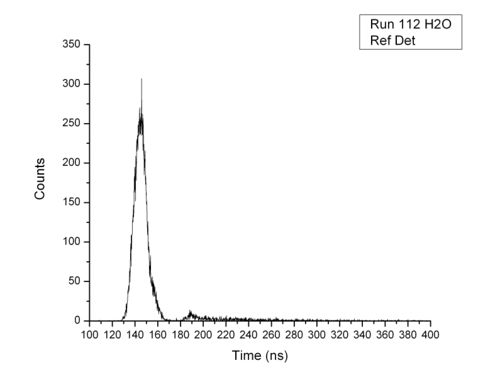
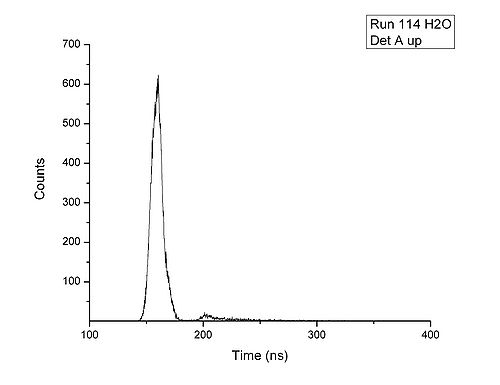
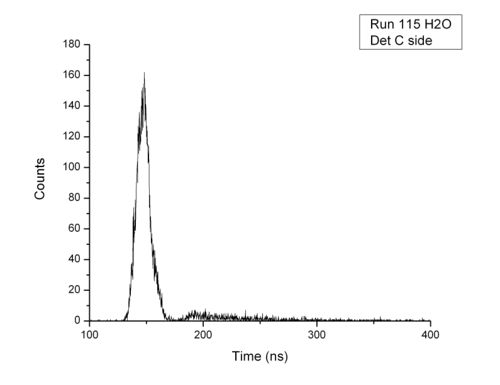
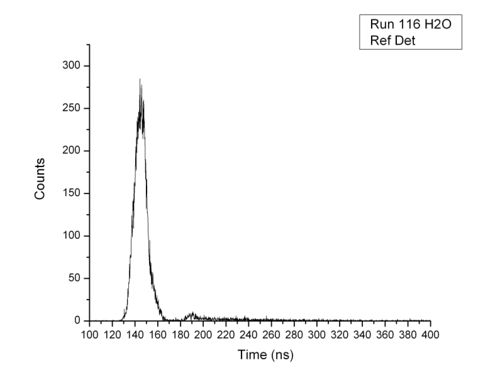
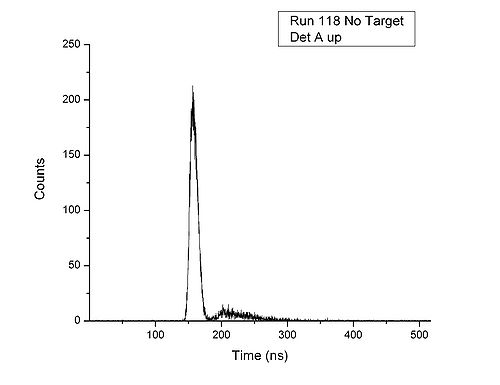
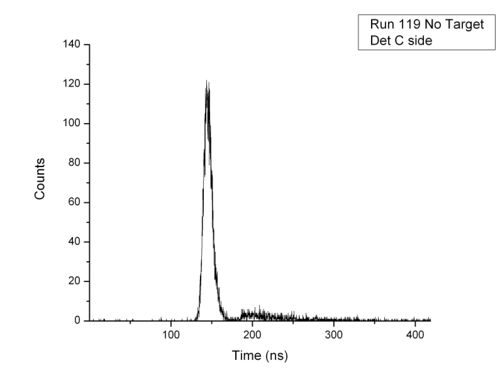
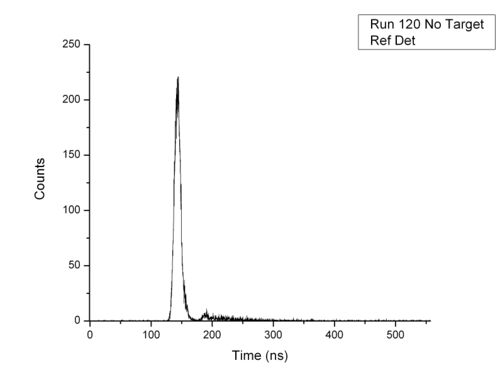
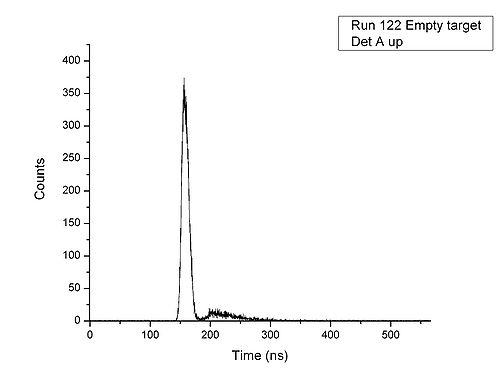
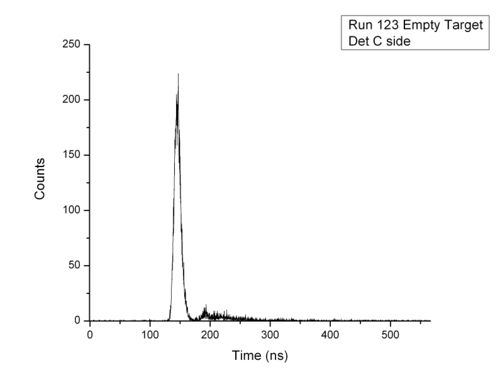
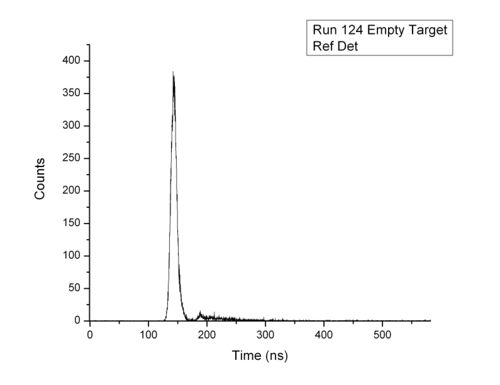
Neutron analysis No Target, Empty Target, H20 Target
The weighted neutron count was found by dividing the total neutron count by the flux recorded by the NaI detector corresponding to those runs.
| Run/File | Total Neutron Count | Weighted Neutron Count | Average Neutron Rate |
| 110 H2O | 2952 | 9.57 E-07 | H2O Avg |
| 111 H2O | 1245 | 4.04 E-07 | |
| 112 H2O | 1424 | 4.62 E-07 | |
| 114 H2O | 2834 | 9.35 E-07 | |
| 115 H2O | 1177 | 3.88 E-07 | |
| 116 H2O | 1251 | 4.13 E-07 | |
| 118 No Target | 2574 | 1.20 E-06 | No Target Avg |
| 119 No Target | 1164 | 5.44 E-07 | |
| 120 No Target | 1212 | 5.66 E-07 | |
| 122 Empty Target | 4161 | 1.10 E-06 | Empty Target Avg |
| 123 Empty Target | 1839 | 4.85 E-07 | |
| 124 Empty Target | 2078 | 5.48 E-07 |
- conclusion
- The above neutron rate from each of the above targets is statistically the same and two standard deviations above zero.
