Se170063 Activity and HL Alternate
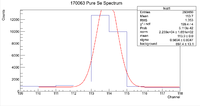
While analyzing the data it became clear that the amplitude of the gaussian fit did not match the amplitude of the peak of interest. Below is an example
This can be corrected in multiple ways. The first way is to use the draw panel to manually adjust the amplitude of the gaussian. The second way (which is the way I used) is to find the maximum value of a histogram in a range of interest using ROOT.
 Int_t max=0;
 hist1->GetXaxis()->SetRange(RangeMin,RangeMax);
 max = hist1 -> GetMaximum();
p0Gauss -> SetParameter(0,max);
This will force the amplitude to be the maximum of the histogram in the region of interest. In previous attempts I simply fit a gaussian function plus a constant so the gaussian would be shifted up to the background. In this attempt, I subtracted the background constant value from the amplitude to find a new background corrected amplitude. Using this amplitude, the mean and standard deviation parameters given by ROOT, I used Mathematica to do the following integral
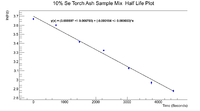
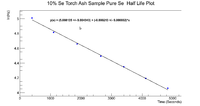
This integral would give me the number of counts. For the error I used the square root of the counts since this is indeed a counting experiment. The linear fits are shown below.
Using the method of calculation outlined above, the half life was found to be
for the mix
for the pure selenium sample
The activities were found to be
for the Pure Se Sample
for the mixture
This gives a ratio of 0.23.
This is the third method that I have tried and gotten very close results. Using the incorrect higher amplitude method I got a ratio of 0.25. Using the corrected amplitude method with the gaussian plus constant fit I got 0.24. Now using the new corrected amplitude along with Mathematica I got 0.23. This seems to tell me that the ratio is indeed around 0.25, even though it is supposed to be 0.5. Looking at just a simple spectrum (which will be the first measurement taken for each sample, the number of counts is significantly higher.
Now note that the Mixture was measured first for 5 minutes, the norm-background gives 7517.2 for the corrected amplitude while the Pure Se sample gives 24304.7 for the corrected amplitude. So roughly 6 minutes later, the pure selenium sample's peak counts is about 3 times higher than that of the mixture.


