Se170063
PAA_Selenium/Soil_Experiments#Selenium_Sample_Analysis
Sample Description
The sample was placed in an aluminum cylinder that was to be irradiated. The target components consisted of a nickel foil on the front of the cylinder with 2 pure selenium pellets under the foil, but still outside the cylinder. Inside the target there was burnt sagebrush ash, which was burned with a blowtorch, and selenium. Below are the masses of the components
Nickel Foil: 0.2783g
Outer Se Pellets: 0.0971g
Sage Ash: 0.5111g
Inner Se Pellets: 0.0523g
Energy
The Calibration for Detector A was done on the morning of 5/23/17 with the MPA software using the thorium rods (as the calibration was fairly close already) and the correction values were found to be Det A Intercept = -12.208800 slope =1.021270
Efficiency
Nickel Information
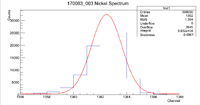
In finding the initial activity of the front nickel foil of this sample, look at the window from [1356,1368]. The method I used here was simply finding the number of counts within this window and subtracting the integral of the constant found by the fit. Below is a picture of the line of interest.
Note that this spectrum is weighted by the inverse of the mass of the nickel. So the natural log of the activity is what we want to put in the .dat file to feed into root. Below is the math that I did to find these numbers
After the number of counts have been found, I used the following formula for the error
So now we have the number of counts for the line of interest and its associated error, so we must convert this into an activity, correct for the efficiency, and take the natural log.
Now we can simply take the natural log of the efficiency corrected activity. To find the error after taking the natural log, use
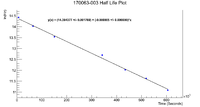
Below is the plot for the activity and half life of the nickel foil
Using the slope of this graph, we can find that the half life is
This does capture the accepted half life of Ni-57 in 2 standard deviations, which is a good sign.
Using the method below and doing a time correction backward 5280 seconds to coincide with the first selenium mixture measurement, we find the activity of the nickel is
Activity and Half Life
Se170063 Activity And Half Life
Alternative Method
Se170063 Activity and HL Alternate
Corrected Alternative method
This time the number of counts was weighted by the mass of the selenium (shouldn't it be Se+ash??) sample.
Runlist
Table with dates and filename and locations on daq1

