|
|
| Line 76: |
Line 76: |
| | =Alternative Method= | | =Alternative Method= |
| | | | |
| − | While analyzing the data it became clear that the amplitude of the gaussian fit did not match the amplitude of the peak of interest. Below is an example
| + | [[Se170063 Activity and HL Alternate]] |
| − | | |
| − | [[File:170063 PureSeSpectrum HighAmplitude.png|200px]] | |
| − | | |
| − | This can be corrected in multiple ways. The first way is to use the draw panel to manually adjust the amplitude of the gaussian. The second way (which is the way I used) is to find the maximum value of a histogram in a range of interest using ROOT.
| |
| − | | |
| − | Int_t max=0;
| |
| − | hist1->GetXaxis()->SetRange(RangeMin,RangeMax);
| |
| − | max = hist1 -> GetMaximum();
| |
| − | | |
| − | p0Gauss -> SetParameter(0,max);
| |
| − | | |
| − | This will force the amplitude to be the maximum of the histogram in the region of interest. In previous attempts I simply fit a gaussian function plus a constant so the gaussian would be shifted up to the background. In this attempt, I subtracted the background constant value from the amplitude to find a new background corrected amplitude. Using this amplitude, the mean and standard deviation parameters given by ROOT, I used Mathematica to do the following integral
| |
| − | | |
| − | <math> \int_{110}^{118}{(A_{corrected})*e^{\frac{-(x-\bar{x})^2}{2*\sigma^2}}dx} </math>
| |
| − | | |
| − | This integral would give me the number of counts. For the error I used the square root of the counts since this is indeed a counting experiment. The linear fits are shown below.
| |
| − | | |
| − | [[File:170063 Mix HalfLife Plot.png|200px]]
| |
| − | [[File:170063 PureSe HalfLife Corrected.png|200px]]
| |
| − | | |
| − | | |
| − | Using the method of calculation outlined above, the half life was found to be
| |
| − | | |
| − | <math> 62.79 \pm 0.99 Minutes </math> for the mix
| |
| − | | |
| − | <math> 54.31 \pm 0.41 Minutes </math> for the pure selenium sample
| |
| − | | |
| − | The activities were found to be
| |
| − | | |
| − | <math> 172.99 \pm 2.33 Hz </math> for the Pure Se Sample
| |
| − | | |
| − | <math> 40.39 \pm 0.27 Hz </math> for the mixture
| |
| − | | |
| − | This gives a ratio of 0.23.
| |
| − | | |
| − | This is the third method that I have tried and gotten very close results. Using the incorrect higher amplitude method I got a ratio of 0.25. Using the corrected amplitude method with the gaussian plus constant fit I got 0.24. Now using the new corrected amplitude along with Mathematica I got 0.23. This seems to tell me that the ratio is indeed around 0.25, even though it is supposed to be 0.5. Looking at just a simple spectrum (which will be the first measurement taken for each sample, the number of counts is significantly higher.
| |
| − | | |
| − | [[File:170063 MixSpec CountDiffExample.png|200px]]
| |
| − | [[File:170063 PureSeSpec CountDiffExample.png|200px]]
| |
| − | | |
| − | Now note that the Mixture was measured first for 5 minutes, the norm-background gives 7517.2 for the corrected amplitude while the Pure Se sample gives 24304.7 for the corrected amplitude. So roughly 6 minutes later, the pure selenium sample's peak counts is about 3 times higher than that of the mixture.
| |
| − | | |
| | | | |
| | =Corrected Alternative method= | | =Corrected Alternative method= |
Revision as of 14:47, 18 October 2017
PAA_Selenium/Soil_Experiments#Selenium_Sample_Analysis
Sample Description
The sample was placed in an aluminum cylinder that was to be irradiated. The target components consisted of a nickel foil on the front of the cylinder with 2 pure selenium pellets under the foil, but still outside the cylinder. Inside the target there was burnt sagebrush ash, which was burned with a blowtorch, and selenium. Below are the masses of the components
Nickel Foil: 0.2783g
Outer Se Pellets: 0.0971g
Sage Ash: 0.5111g
Inner Se Pellets: 0.0523g
Energy
LB May Calibration 2017
The Calibration for Detector A was done on the morning of 5/23/17 with the MPA software using the thorium rods (as the calibration was fairly close already) and the correction values were found to be Det A Intercept = -12.208800 slope =1.021270
Efficiency
LB May 2017 Det A Efficiency
Nickel Information
In finding the initial activity of the front nickel foil of this sample, look at the window from [1356,1368]. The method I used here was simply finding the number of counts within this window and subtracting the integral of the constant found by the fit. Below is a picture of the line of interest.
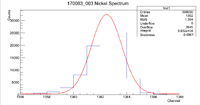
Note that this spectrum is weighted by the inverse of the mass of the nickel. So the natural log of the activity is what we want to put in the .dat file to feed into root. Below is the math that I did to find these numbers
[math] N = N_{total} - \int_{1356}^{1368} C dE [/math]
After the number of counts have been found, I used the following formula for the error
[math] \sigma_N = \sqrt{N} [/math]
So now we have the number of counts for the line of interest and its associated error, so we must convert this into an activity, correct for the efficiency, and take the natural log.
[math] A_t = \frac{N_t}{t} [/math]
[math] \sigma_{A_t} = \frac{\sigma_{N}}{t} [/math]
[math] A'_t = \frac{A_t}{\epsilon} [/math]
[math] \sigma_{A'_t} = \frac{\sigma_{A_t}}{\epsilon} [/math]
Now we can simply take the natural log of the efficiency corrected activity. To find the error after taking the natural log, use
[math] \sigma_{\ln{A'_t}} = \frac{\sigma_{A'_t}}{A'_t} [/math]
Below is the plot for the activity and half life of the nickel foil
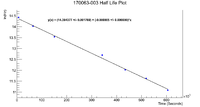
Using the slope of this graph, we can find that the half life is
[math] t_{\frac{1}{2}} = \frac{\ln{2}}{\lambda} = 35.71 hours [/math]
[math] \sigma_{t_{\frac{1}{2}}} = \frac{\ln{2}*\sigma_{lambda}}{\lambda^2} = 0.04 hours[/math]
This does capture the accepted half life of Ni-57 in 2 standard deviations, which is a good sign.
Using the method below and doing a time correction backward 5280 seconds to coincide with the first selenium mixture measurement, we find the activity of the nickel is
[math] A_0 = 1835578.669 \pm 3268.41 \rightarrow 49.61 \pm 0.88 \mu Ci[/math]
Activity and Half Life
Se170063 Activity And Half Life
Alternative Method
Se170063 Activity and HL Alternate
Corrected Alternative method
This time the number of counts was weighted by the mass of the selenium (shouldn't it be Se+ash??) sample.
Runlist
Table with dates and filename and locations on daq1
LB_May_2017_Irradiation_Day#10.25_Se_Soil_Mix
PAA_Selenium/Soil_Experiments#Selenium_Sample_Analysis

