LB Summer 2017 JLab Vertex Work
Useful Commands
To Run GEMC 4a.0.0 on LDS3
nohup ~/src/CLAS/GEMC/clas12Tags/4a.0.0/source/gemc -USE_GUI=0 -INPUT_GEN_FILE="LUND,test.LUND" -N=10 eg12_sol_XRaster.gcard >>/dev/null
To Convert the GEMC .ev output file to a hipo file
~/src/CLAS/coatjava-4a.0.0/bin/evio2hipo -r 11 -t -1.0 -s 1.0 -o out.hipo SIDIS.evio
To perform the reconstruction on the .hipo file that has been converted from a .ev file
~/src/CLAS/coatjava-4a.0.0/bin/notsouseful-util -o rec.hipo -i out.hipo -c 1
~/src/CLAS/coatjava-4a.0.0/bin/run-groovy ../../../SweetSpot/Hipo2Text.groovy SIDIS_Deut_5.hipo
Simulation Setup
The following simulations were done using GEMC 4a.0.0.It is useful to note that the LUND file vertices are in units of cm, while the reconstructed events are in cm as well. It should be noted that the generated position of the particle in the GenPart Bank is in mm, so it must be divided by 10 to get the right units.Below is a sample gcard that was used for many of my simulations
<gcard>
      <detector name="../../../../../../../clas12Tags/4a.0.0/experiments/clas12/fc/forwardCarriage" factory="TEXT" variation="original"/>

      <detector name="../../../../../../../clas12Tags/4a.0.0/experiments/clas12/dc/dc" factory="TEXT" variation="java"/>

      <detector name="../../../../../../../clas12Tags/4a.0.0/experiments/clas12/ec/ec" factory="TEXT" variation="java"/>

      <detector name="../../../../../../../clas12Tags/4a.0.0/experiments/clas12/ctof/ctof" factory="TEXT" variation="cad"/>
      <detector name="../../../../../../../clas12Tags/4a.0.0/experiments/clas12/ctof/cad/" factory="CAD"/>

      <detector name="../../../../../../../clas12Tags/4a.0.0/experiments/clas12/ftof/ftof" factory="TEXT" variation="java"/>

      <detector name="../../../../../../../clas12Tags/4a.0.0/experiments/clas12/htcc/htcc" factory="TEXT" variation="original"/>

      <detector name="../../../../../../../clas12Tags/4a.0.0/experiments/clas12/pcal/pcal"     factory="TEXT" variation="java"/>

      <detector name="../../../../../../../clas12Tags/4a.0.0/experiments/clas12/magnets/solenoid" factory="TEXT" variation="original"/>
<detector name="../../../../../../../clas12Tags/4a.0.0/experiments/clas12/magnets/torus" factory="TEXT" variation="original"/>
<detector name ="../../../../../../../clas12Tags/4a.0.0/experiments/clas12/targets/target" factory="TEXT" variation="lH2"/>
<detector name="../../../../../../../clas12Tags/4a.0.0/experiments/clas12/bst/bst" factory="TEXT" variation="java"/>
<detector name="../../../../../../../clas12Tags/4a.0.0/experiments/clas12/cnd/cnd" factory="TEXT" variation="original"/>
<detector name="../../../../../../../clas12Tags/4a.0.0/experiments/clas12/micromegas/micromegas" factory="TEXT" variation="original"/>
      <option name="SCALE_FIELD" value="clas12-torus-big, -1"/>

      <option name="HALL_FIELD"  value="clas12-solenoid"/>

      <option name="OUTPUT" value="evio,eg12_sol_75k_NoRaster_30DegRot.ev"/>
</gcard>
and here is a sample GEMC command line that was used for the simulations. Obviously the name of the LUND file, the number of events, and the output filename will change.
~/src/CLAS/GEMC/clas12Tags/4a.0.0/source/gemc -USE_GUI=0 -INPUT_GEN_FILE="LUND,test.LUND" -N=10 eg12_sol_XRaster.gcard
The LUND files were created using WriteLUND.C. The vertex positions are generated by a RNG whose output is between 2 numbers. This will determine if the target is 1D,2D,3D. To check the angles on the LUND files, run a GEMC simulation with only a few events to see where the particles hit within the detector. For angles
theta= 25 Degrees
phi= 30 Degrees
This has been investigated for GEMC 2.5. There seems to be a problem with the gui such that the detector will not appear. Assuming the entire coordinate system hasn't changed, then the results should be the same as seen here Phi angle gcard vs. LUND
Point Target
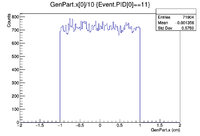
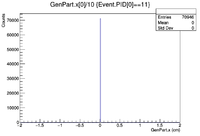
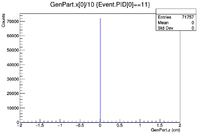
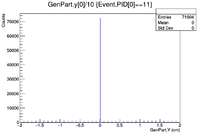
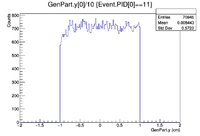
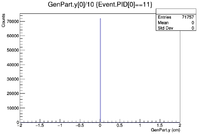
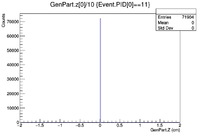
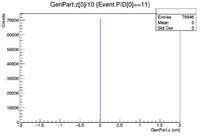
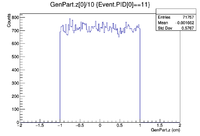
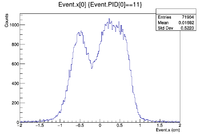
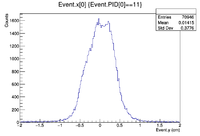
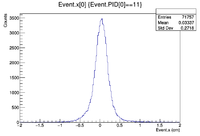
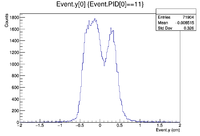
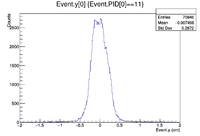
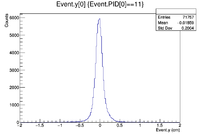
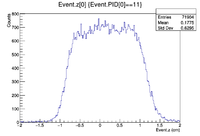
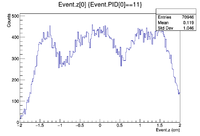
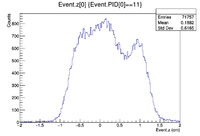
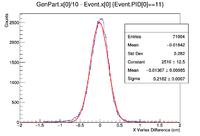
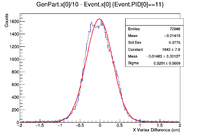
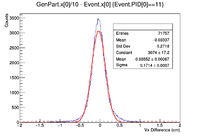
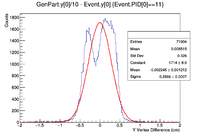
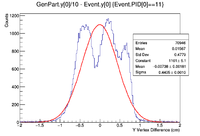
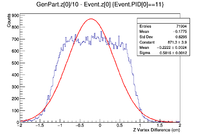
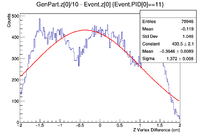
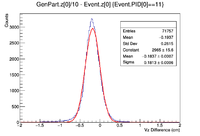
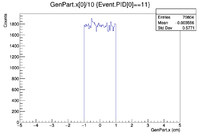
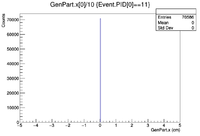
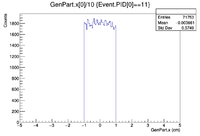
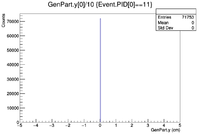
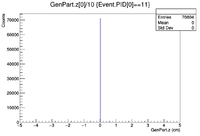
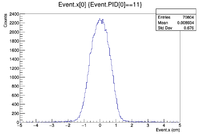
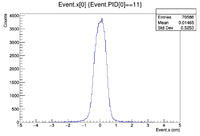
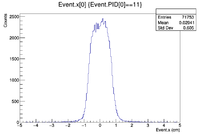
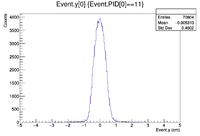
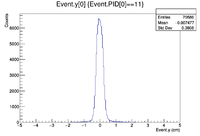
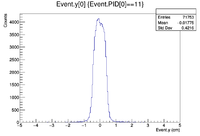
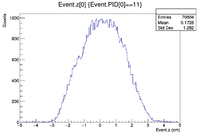
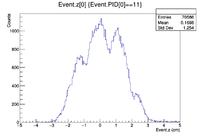
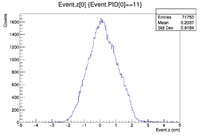
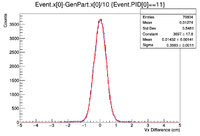
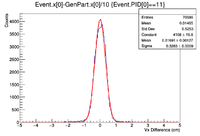
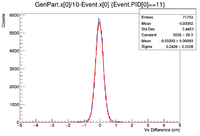
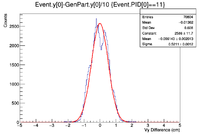
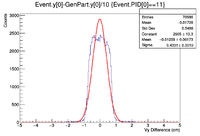
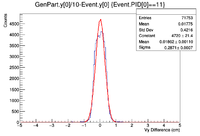
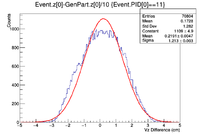
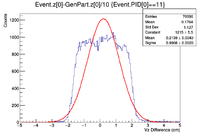
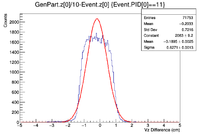
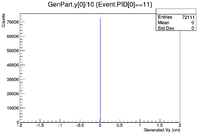
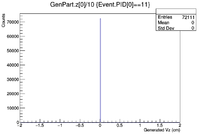
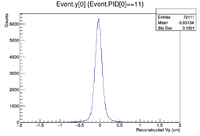
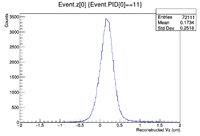
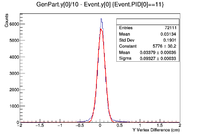
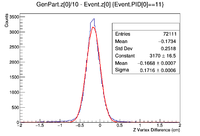
Below are the histograms for a target with generated Vx,Vy, and Vz all equal to zero. There are 75k generated events. Note that these differences are not cuts, but the reconstructed vertices for the entire target. A sample command line is
CLAS12->Draw("GenPart.z[0]/10 - Event.z[0]>>(200,-2,2)","Event.PID[0]==11");
| X Vertex Info | Y Vertex Info | Z Vertex Info | ||
|---|---|---|---|---|
| Generated Particles | 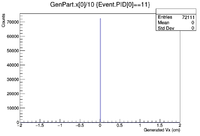 |
 |
| |
| Reconstructed Particles | 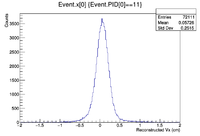 |
 |
| |
| Vertex Differences | 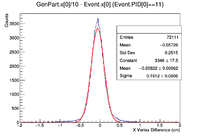 |
 |
| |
| Resolution (cm) | 0.1612 +/- 0.0006 | 0.09327 +/- 0.00033 | 0.1716 +/- 0.0006 |
Line Targets
Noting that some of the reconstructed events have valleys where generated events may not be getting reconstructed, I will attempt to find those events in the ascii2root.C program and create a LUND file to simulate and run the reconstruction again to see if it is reproducible. To do this I will insert an if statement into the ascii2root program that will look in a region of the generated events and ask if the difference between the generated values and the reconstructed values is greater than some number (probably 0.3 to start) i.e. if GenPart.z/10 - Event.z > 0.3. Using the created LUND file and running GEMC, it would seem that the events in the region of interest are not reproducible.
Consider the reconstruction of the 2cm Z-Raster target. It is noticeable that there is a dip in the reconstructed events from 0.6cm < Event.x < 0.8cm. Using a few events in the LUND file with all generated vertex points at zero, and some within the above region of interest it can be seen that the vertices in th
| LUND file vertex (cm) | 1st Reconstruction Event.z (cm) | 2nd Reconstruction Event.z (cm) |
|---|---|---|
| 0.000 | 0.000 | 0.262 |
| 0.000 | 0.070 | 0.127 |
| 0.000 | 0.016 | 0.337 |
| 0.000 | 0.151 | 0.463 |
| 0.000 | 0.173 | 0.267 |
| 0.393 | 0.792 | 0.684 |
| 0.793 | 1.010 | 0.502 |
| 0.508 | 0.822 | 0.724 |
2D Targets
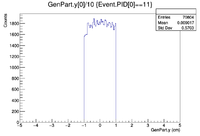
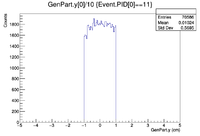
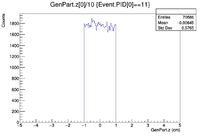
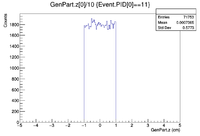
The following targets are squares with side lengths of 2cm centered at x=y=z=0cm. These simulations were run on GEMC 4a.0.0 with 75k events
GEMC 4a.2.0
I ran similar simulations to the ones above with GEMC 4a.2.0 using 75k events for each simulation. I used the gcard that can be found in /home/lds/src/CLAS/GEMC/experiments/eg12/LB_Vertex/Summer_2017/Solenoid_On/GEMC_4a.2.0/30DegRot/No_Rast.
The GEMC command line I used is
nohup ~/src/CLAS/GEMC/clas12Tags/4a.2.0/source/gemc* -USE_GUI=0 -N=75000 -INPUT_GEN_FILE="LUND,2cm_XYZRaster_75k.LUND" clas12.gcard >> /dev/null
I then converted the ev file from the GEMC output into a hipo file as seen above (the 4a.7.1 coatjava converter was having trouble).
The reconstruction was done using the program notsouseful-util with the command line
~/src/CLAS/clas12-offline-software/coatjava/bin/notsouseful-util -o rec.hipo -i out.hipo -c 1
Point Target
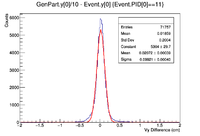
Below are the plots for a point target centered at (0cm,0cm,0cm)
| Vx Difference | |
| Vy Difference | |
| Vz Difference | |
| X Resolution (cm) | |
| Y Resolution(cm) | |
| Z Resolution (cm) |
