Isotropic Spread in CM for 5 to 40 degrees in Lab Frame

From New IAC Wiki
Jump to navigation Jump to search
[math]\underline{\textbf{Navigation}}[/math]

[math]\vartriangleleft [/math] [math]\triangle [/math] [math]\vartriangleright [/math]

Isotropic Spread in CM Frame for 5-40 degrees in Lab

As was done for the situation of 1000 events per degree in the lab frame of reference, the isotropic distribution of scattering angle theta in the center of mass frame can be weighted to reproduce a Moller differential cross-section.
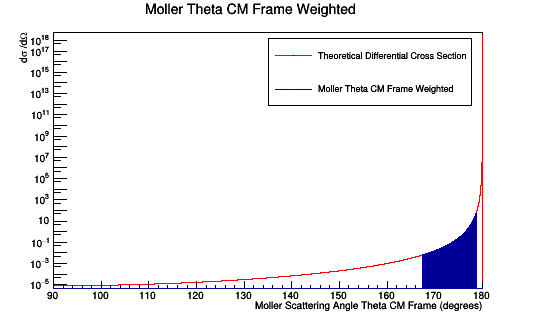

LH2 0Sol n100Tor 11GeV Phi0deg ShieldOut MolThetaCMWeighted.png


Similarly, as was done earlier, the center of mass frame is transfered to the lab frame.
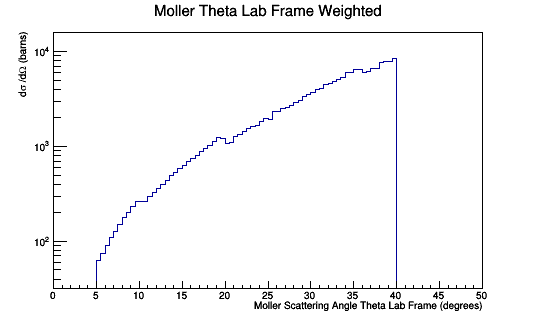
LH2 0Sol n100Tor 11GeV Phi0deg ShieldOut MolThetaLabWeighted.png


Since the dimension parallel to the direction of motion "compresses" with speeds approaching the speed of light, the number of events that occur at 5 degrees are different than 40 degrees. Collecting the number of events that occur within 0.5 degree bin width.
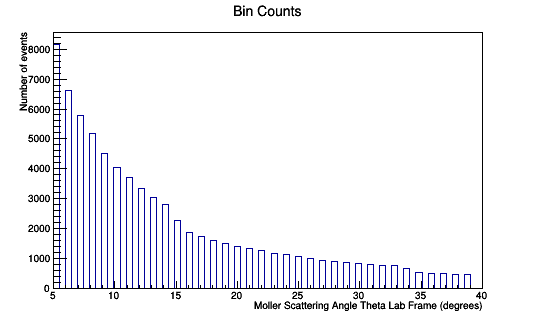

BinCounts.png

This can be plotted by dividing each entry into the bin by the number of events per that bin and multiplying by the corresponding weight factor.
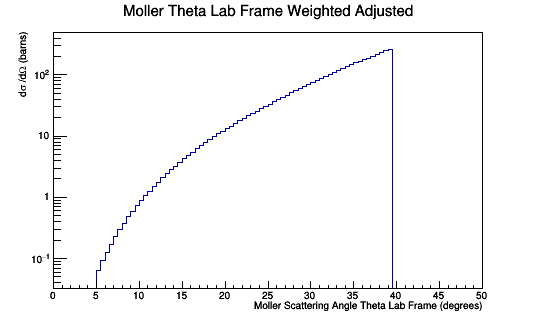
LH2 0Sol n100Tor 11GeV Phi0deg ShieldOut MolThetaLabWeightedAdjusted.png


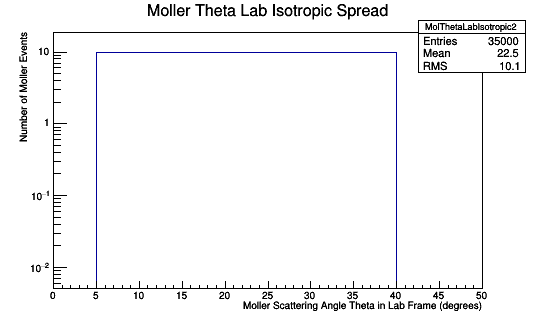
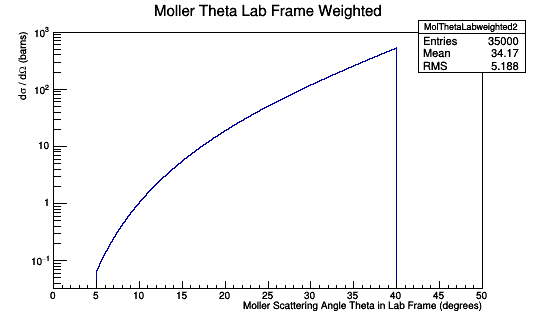
If we set the bin width for Theta in the Lab frame to be 0.01 degrees wide, then we can limit the number of times Moller events occur within such a range to once. This limiting corresponds to an isotropic spread of the scattering Theta in the lab frame.
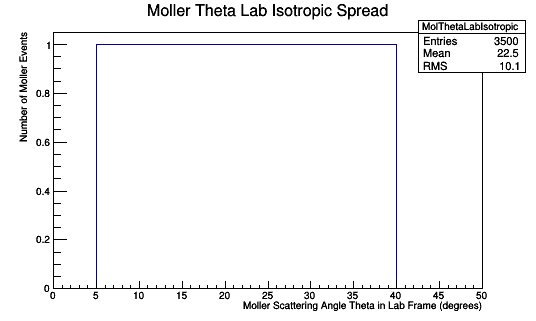
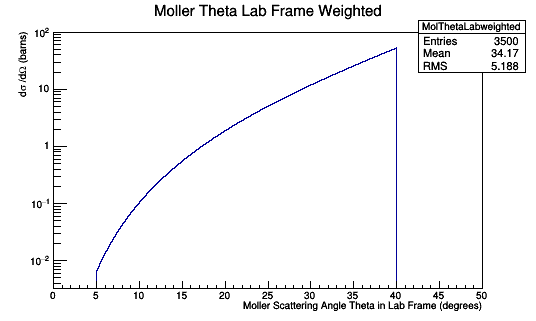
MolThetaLabIsotropic.pngMolThetaLabWeighted.png


MolThetaLabIsotropic2.pngMolThetaLabWeighted2.png

Applying weight to DC hits

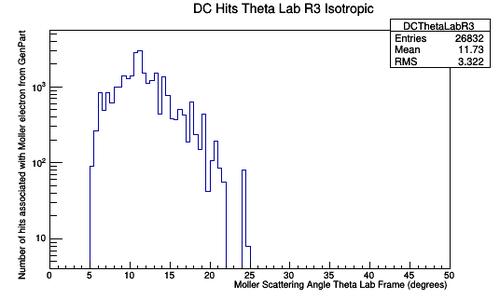
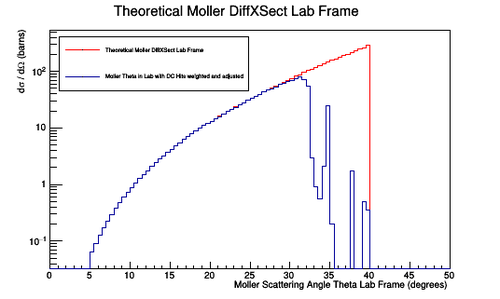
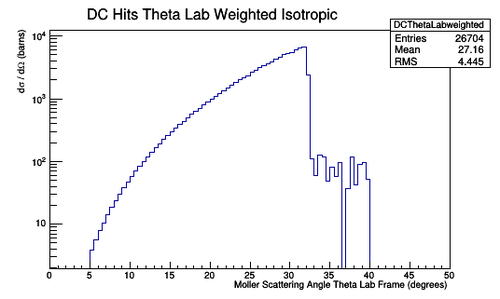
Ideally, we would like to be able to recover the Moller differential cross section from DC hits. Since this occurs in the lab frame, we will use the differential cross section found in the previous section in this frame. Each hit in the DC is associated with a generated particle's angle theta, plotting this we find:


Below is a plot of Theta from GenPart if Moller hits any one DC Layer (event is only counted once no matter how many layers register a DC hit). The Moller X-sect is overlayed. The drift chambers appear to be less efficiency at detecting high angle Moller electrons.
DC Hits Theory
Figure 13b: A plot of Moller electron scattering angle theta in the lab frame that have an associated hit in the DC. Each occurrence of a generated particle's angle theta is counted once, regardless of the number of hits associated with it. A weight has been applied to each occurrence of the angle theta that yields the Moller scattering differential cross section. The theoretical Moller differential cross-section is plotted for comparison.

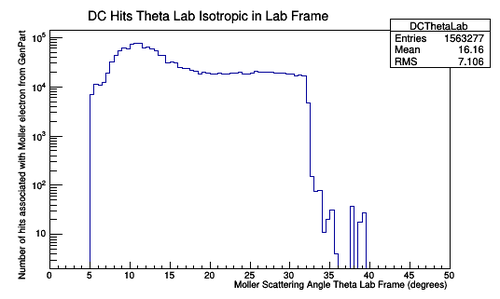
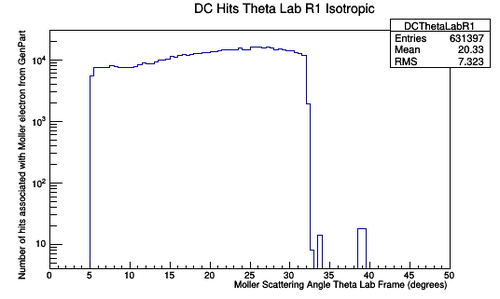
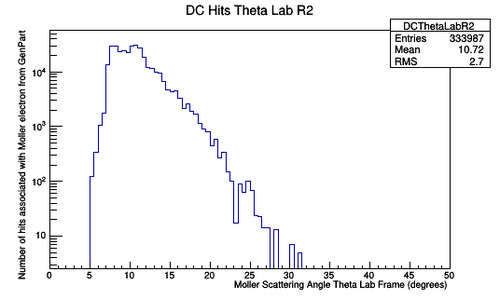
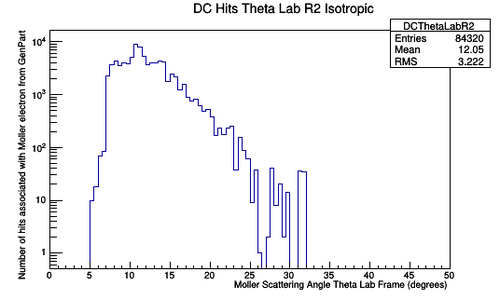
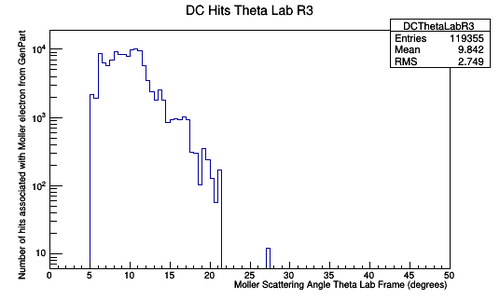
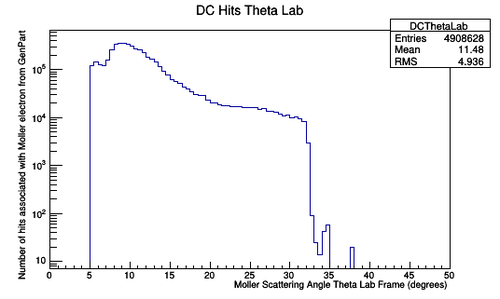
Below is what happens if you ask for all hits in the drift chambers to be plotted as a function of the moller electron angle. You see a lot more hits for the lower angle moller electrons. Perhaps the higher angle moller electrons are bending and missing the outer drift chamber.

DC Hits Theta Lab
Figure 13: A plot of Moller electron scattering angle theta in the lab frame that have an associated hit in the DC. Each occurrence of a DC hit associated with a generated particle's angle theta is recorded.
DC Hits Theta Lab
Figure 13: A plot of Moller electron scattering angle theta in the lab frame that have an associated hit in the DC. Each occurrence of a DC hit associated with a generated particle's angle theta is recorded.

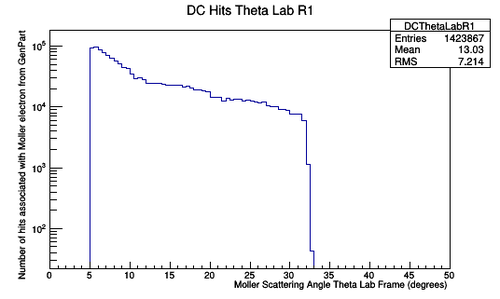
Limiting the number of times the angle theta is counted, regardless of the amount of hits registered in the DC, we can apply a weight and renormalize the bins to obtain the Moller differential cross-section.


Below is a break down of the above weighted hits in each Region.


Moller Momentum Center of Mass Frame
Figure 1a: A plot of Moller electron momentum in the center of mass frame.
Moller Momentum Center of Mass Frame
Figure 1a: A plot of Moller electron momentum in the center of mass frame.


Moller Momentum Center of Mass Frame
Figure 1a: A plot of Moller electron momentum in the center of mass frame.
Moller Momentum Center of Mass Frame
Figure 1a: A plot of Moller electron momentum in the center of mass frame.
Moller Momentum Center of Mass Frame
Figure 1a: A plot of Moller electron momentum in the center of mass frame.
Moller Momentum Center of Mass Frame
Figure 1a: A plot of Moller electron momentum in the center of mass frame.


[math]\underline{\textbf{Navigation}}[/math]

[math]\vartriangleleft [/math] [math]\triangle [/math] [math]\vartriangleright [/math]