Difference between revisions of "DeltaDoverD Progress"

From New IAC Wiki
Jump to navigation Jump to search
Line 176: Line 176:
  
  
==11/21/08==
+
=11/21/08=
  
 
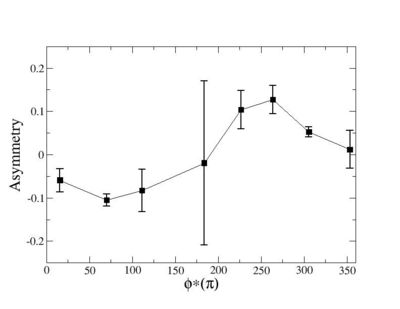
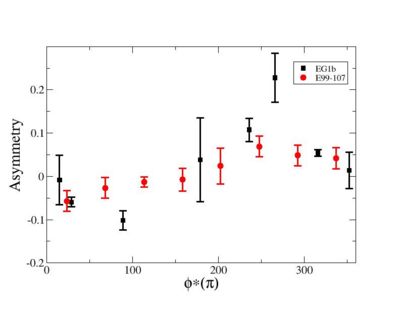
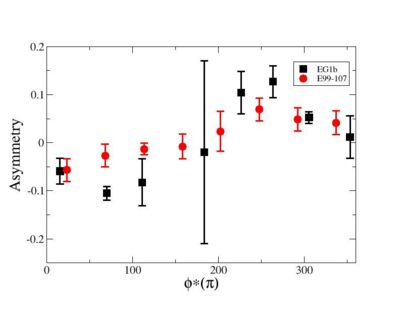
  Rebin asymmetry hisograms and combine the two into a total asymmetry histogram
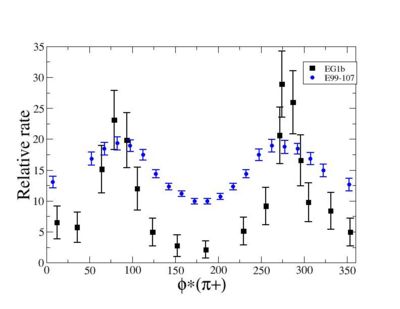
 
  Rebin asymmetry hisograms and combine the two into a total asymmetry histogram
  
 
[http://www.iac.isu.edu/mediawiki/index.php/Delta_D_over_D Go Back]
 
[http://www.iac.isu.edu/mediawiki/index.php/Delta_D_over_D Go Back]

Revision as of 17:37, 21 November 2008

9/5/08

SIDIS Analysis

a.) Cross-Section comparison

i.) Calculate absolute cross section for [math]\cos(\theta_{pi})[/math] = 0.5, 1 < Q^2 < 4 GeV^2 , W = 1.45 +/- 0.2 GeV

[math]{\sigma} = \frac{1}{ L_{int}}dN = \frac{35}{3.3 \times 10^{34}} \times cm^2 = 10.61 \times10^{-34} \times 10^{24} \times [barn] = 1.061 \times 10^{-3} [\mu barn][/math]

Luminosity Calculation

Phi angle in CM Frame vs Relative Rate cos theta 0-4 0-6 W 1-45.jpg


ii.) Plot [math]\phi_{diff}^{CM}[/math]-vs-[math]cos{\theta}_{\pi}^{LAB}[/math] when [math]cos{\theta}_{e}^{CM}[/math] = -0.3 also plot [math]\phi_{diff}^{CM}[/math]-vs- [math]cos{\theta}_{e}^{LAB}[/math]

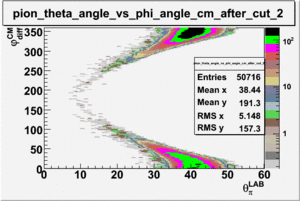
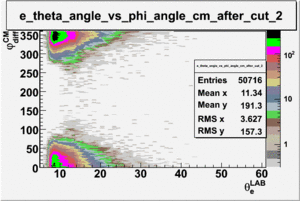
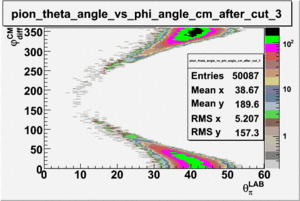
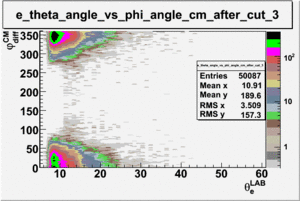
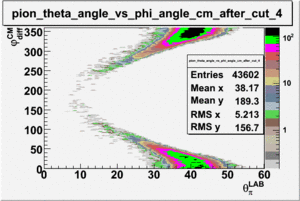
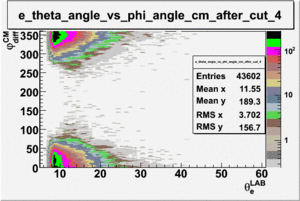
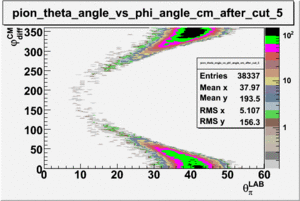
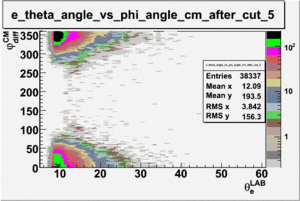
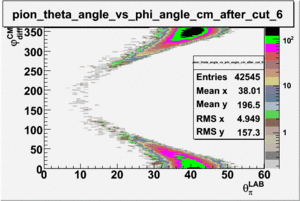
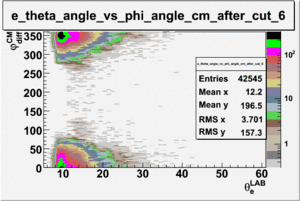
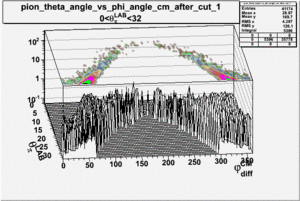
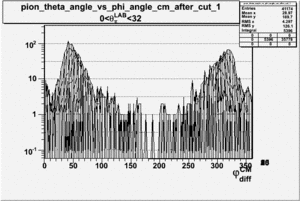
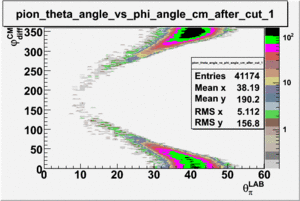
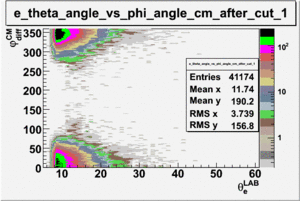
As one can see from histograms of the pion_theta_angle_vs_phi_angle_in_CM_Frame and the electron_theta_angle_vs_phi_angle_in_CM_Frame, the pion and electron acceptance in the region of [math]\phi_{diff}^{CM}=180[/math] is nearly zero(significantly low).

electron sector pion_theta_angle_vs_phi_angle_in_CM_Frame_after_cuts(EC_inner>0.06, EC_tot/p>0.2, nphe>2.5, [math]0.9\lt M_x\lt 1.1[/math], [math]1.1\lt W\lt 1.5[/math] ) electron_theta_angle_vs_phi_angle_in_CM_Frame_after_cuts(EC_inner>0.06, EC_tot/p>0.2, nphe>2.5, [math]0.9\lt M_x\lt 1.1[/math], [math]1.1\lt W\lt 1.5[/math] )
1 Pion theta angle vs phi angle in cm frame after cuts e sector 1.gif Electron theta angle vs phi angle in cm frame after cuts e sector 1.gif
2 Pion theta angle vs phi angle in cm frame after cuts e sector 2.gif Electron theta angle vs phi angle in cm frame after cuts e sector 2.gif
3 Pion theta angle vs phi angle in cm frame after cuts e sector 3.gif Electron theta angle vs phi angle in cm frame after cuts e sector 3.gif
4 Pion theta angle vs phi angle in cm frame after cuts e sector 4.gif Electron theta angle vs phi angle in cm frame after cuts e sector 4.gif
5 Pion theta angle vs phi angle in cm frame after cuts e sector 5.gif Electron theta angle vs phi angle in cm frame after cuts e sector 5.gif
6 Pion theta angle vs phi angle in cm frame after cuts e sector 6.gif Electron theta angle vs phi angle in cm frame after cuts e sector 6.gif


Pion theta vs phi angle cm Theta pion lab 0 32 3D.gifPhi angle cm Theta pion lab 0 32 3D.gif

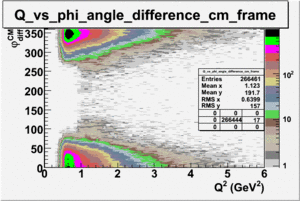
[math]Q^2[/math]_vs_[math]\phi_{diff}^{CM}[/math] plot shows that the [math]Q^2[/math] cut should not make much difference on [math]\phi_{diff}^{CM}[/math] plot. The cut around [math]1 GeV^2 \lt Q^2\lt 2 GeV^2[/math] should reduce the number of pions around 0 and 360 of phi angle.

Q sqrd vs phi angle in cm frame after cuts all Q.gif


9/19/08

SIDIS Analysis

a.) Cross-Section comparison

i.) Calculate absolute cross section for [math]\cos(\theta_{pi})[/math] = 0.5, 1 < Q^2 < 4 GeV^2 , W = 1.45 +/- 0.2 GeV

[math]\frac{d \sigma}{d \Omega^*_{\pi}} = \frac{1.061 \times 10^{-3} [\mu barn]}{0.88} = 0.0012 \ne 2.4[/math]?


Documentation


The five-fold differential cross section for single pion production is equal to the following:

[math]\frac{\partial^5 \sigma}{\partial E_f \partial \Omega_e \partial {\Omega_{\pi}}^*} = \frac{1}{2 \pi} \Sigma \frac{1}{L_{int} A_{cc} \epsilon_{CC} \Delta W \Delta Q^2 \Delta cos {\theta_{\pi}}^* {\phi_{\pi}}^*} \frac{d(W, Q^2)}{d(E_f, cos \theta_e)}[/math]

The Jacobian term can be given as:

[math]\frac{d(W, Q^2)}{d(E_f, cos \theta_e)} = \frac{2 M_p E_i E_f}{W}[/math]


[math]\frac{\partial^5 \sigma}{\partial E_f \partial \Omega_e \partial {\Omega_{\pi}}^*} = \Gamma_{v}\times \frac{d^2 \sigma}{d {\Omega_{\pi}}^*}[/math]


where [math]\Gamma_{v}[/math] is the virtual photon flux and can be written as

[math]\Gamma_{v} = \frac{\alpha}{2 \pi^2 Q^2} \frac{(W^2 - {M_p}^2)E_f}{2M_p E_e} \frac{1}{1-\epsilon}[/math]
[math]\epsilon = (1 + 2(1+\frac{{\nu}^2}{Q^2})tan^2 \frac{\theta_e}{2})^{-1}[/math]

The reason of having low cross section might be binning

In paper they use the following number of bins:


Variable Num. Bin Range Bin Size
W 27 1.15 - 1.7 GeV 20 MeV
[math]Q^2[/math] 7 1.1 - 5.0 [math]GeV^2[/math] variable
[math]cos {\theta_{\pi}}^*[/math] 10 -1.0 - 1.0 0.2
[math]{\phi_{\pi}}^*[/math] 24 -180. - 180 15


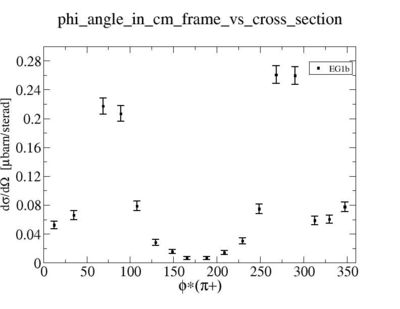
Number of bins in my case were 360.


Number of bins equal is ~24

Phi angle in cm frame vs cross section actual one cuts on MissingMass W cos theta 0-5 nocut onQsqr.jpg

When i applied [math]1.6\lt Q^2\lt 1.84[/math] cut, the number of entries were reduced to 152.

In paper they use liquid-hydrogen unpolarized target(we have NH3 and ND3 polarized). The polarized electron beam current is 8 nA(in our case it is about 6 nA). and luminosity is different too. It also depends on statistics.

ii.) What is smallest angular coverage of EC (8 degrees?) Determine phi region where there is no acceptance ( where should we stop plotting data)?

iii.) Asymmetry Calculation

a.) Beam Asymmetry Plot

In order to plot Beam Asymmetry we need to plot for the first time the histogram of the invariant_mass_vs_cross_section. Then determine the structure function fitting the cross section and calculating the beam asymmetry function which is given as :

[math]A_{TL^'} = \sqrt{2\epsilon (1 - \epsilon)} \sigma_{LT^'} \times sin{\phi_{\pi}}^*[/math]

for given cos(theta) of the pion in cm, Q^2 and W invariant mass.

Choose kinematics ( a single theta and phi point )to max our stats and comparison to paper Histogram the following

  1. Number of e-pi coincidence events, number of FC counts
  2. Number of e-pi coincidence events/FC counts
  3. Number of e-pi coincidence events/FC count/Pt

for groups of runs with h_e,P_t = ++, +-, -+, --

table with 4 columns of h_e, P_t and 3 rows of the above histograms

9/26/08

SIDIS Analysis

1.) make semi-inclusive spectrum:

a.) h>0 Pt>0 b.) h > 0 pt<0 c.)h<0 pt>0 d.)h<0 pt<0

2.) ad up opposite target polarization histograms

3.) subtract h> 0 and h<0


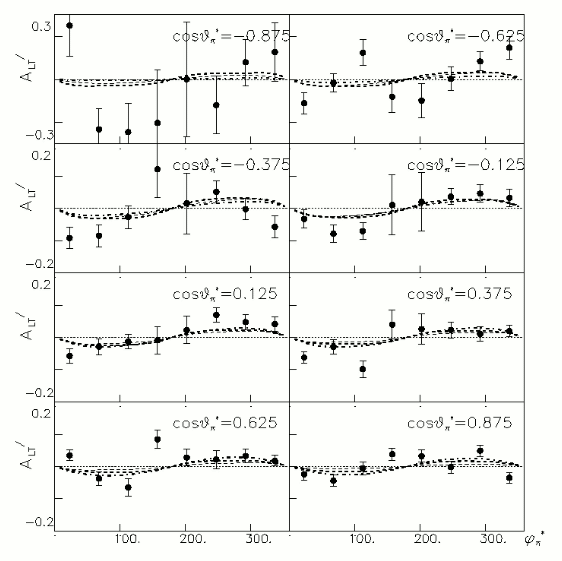
Electron beam helicity asymmetry vs phi angle cm from paper.gif


helflag = 1 =>

helflag = 2 =>

helflag = 3 =>

helflag = 4 =>


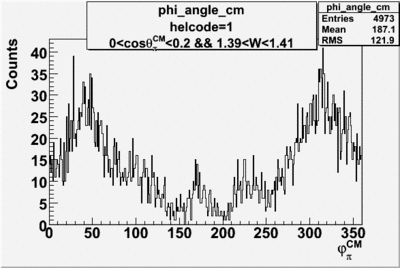
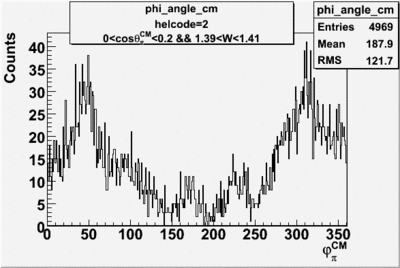
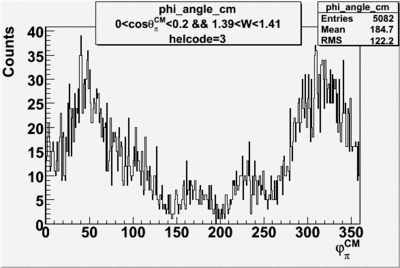
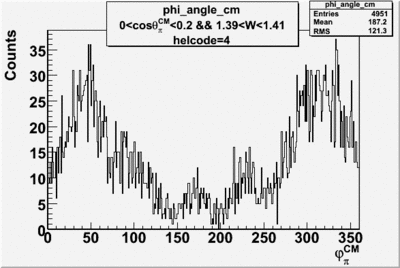
Helcode 1 phi angle cm frame opposite target polarizations are added W 1-4 costhetapionCM 0-1.gifHelcode 2 phi angle cm frame opposite target polarizations are added W 1-4 costhetapionCM 0-1.gif Helcode 3 phi angle cm frame opposite target polarizations are added W 1-4 costhetapionCM 0-1.gifHelcode 4 phi angle cm frame opposite target polarizations are added W 1-4 costhetapionCM 0-1.gif


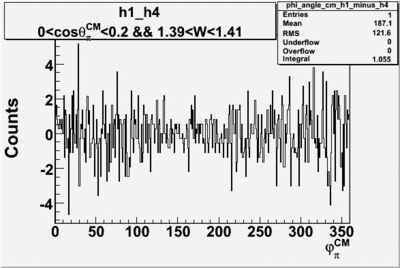
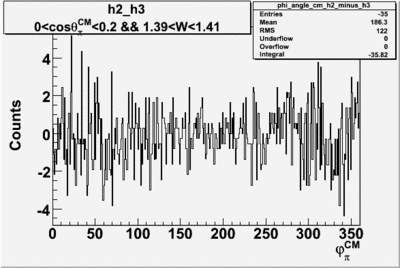
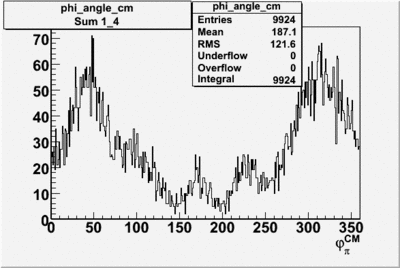
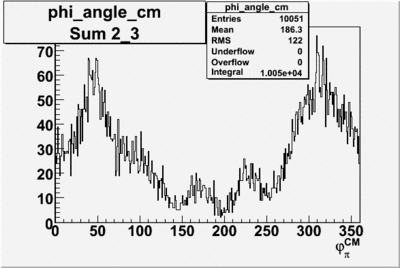
1 4substructed helcodes phi angle cm frame.gif3 2substructed helcodes phi angle cm frame.gif
1 4sum helcodes phi angle cm frame.gif3 2sum helcodes phi angle cm frame.gif


1 4substructed helcodes phi angle cm frame xmgrace.jpg3 2substructed helcodes phi angle cm frame xmgrace.jpg

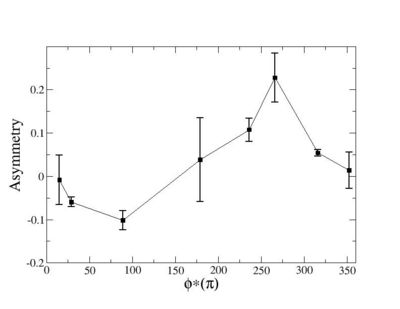
Phi_angle_CM vs Asymmetry

Compared data(there is no table for asymmetry values like cross section):

1 4substructed helcodes phi angle cm frame xmgrace and results from.jpg3 2substructed helcodes phi angle cm frame xmgrace and results from.jpg


11/21/08

Rebin asymmetry hisograms and combine the two into a total asymmetry histogram
Go Back