DF Definitions of Tracking Elements
Hits
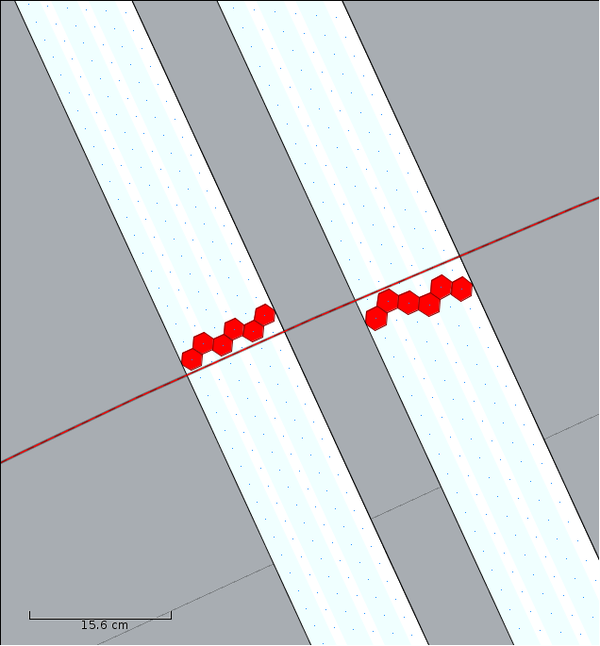
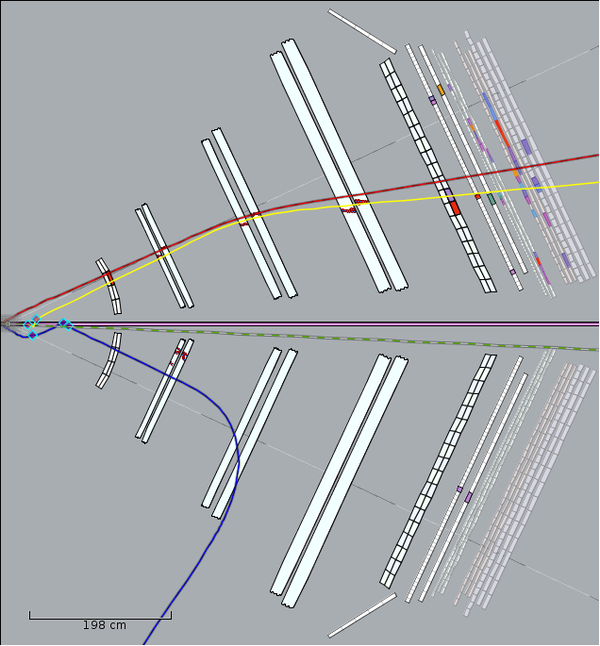
Hits are representations of the locations where a particle flying through the drift chamber layers induces a voltage pulse in a nearby wire. In the image below they are represented by the red hexagons. Note that the fact that the track doesn't intersect the hexagons is due to projecting the 3D data onto a 2D plane.
Below is an example of how Hits are stored in a Hipo file.
SHOWING BANK
------------------------+---------------------------+
>>>> GROUP (group= 20621) (name=HitBasedTrkg::HBHits):
------------------------+---------------------------+
id ( SHORT) : 114 129 125 103 56 54 55 52 53 50 72 73 74 76 90 85 86 83 84 94 92 130 132 133 81 87 134 88 113 122 112 120 111 110 109 108 106 105 98 124 100 101 115 116 1 2 3 4 5 6 7 8 9 10 11 12 13 14 15 16 18 17 20 19 21 23 24 25 26 27 32 34 33 36 35 39 38 41 40
status ( SHORT) : 0 0 0 0 0 0 0 0 0 0 0 0 0 0 0 0 0 0 0 0 0 0 0 0 0 0 0 0 0 0 0 0 0 0 0 0 0 0 0 0 0 0 0 0 0 0 0 0 0 0 0 0 0 0 0 0 0 0 0 0 0 0 0 0 0 0 0 0 0 0 0 0 0 0 0 0 0 0 0
sector ( BYTE) : 1 1 1 1 1 1 1 1 1 1 1 1 1 1 1 1 1 1 1 1 1 1 1 1 1 1 1 1 1 1 1 1 1 1 1 1 1 1 1 1 1 1 1 1 3 3 3 3 3 3 3 3 3 3 3 3 3 3 3 3 3 3 3 3 3 3 3 3 3 3 3 3 3 3 3 3 3 3 3
superlayer ( BYTE) : 2 2 2 2 2 2 2 2 2 2 2 2 2 2 2 2 2 2 2 2 2 2 2 2 2 2 2 2 2 2 2 2 2 2 2 2 2 2 2 2 2 2 2 2 1 1 1 1 1 1 2 2 2 2 2 2 3 3 3 3 3 3 3 3 4 4 4 4 4 4 5 5 5 5 5 5 5 5 5
layer ( BYTE) : 1 2 3 5 3 4 4 5 5 6 1 2 2 3 4 5 5 6 6 1 2 2 3 4 5 5 6 6 1 1 2 2 3 3 4 4 5 5 1 2 3 4 4 5 1 2 3 4 5 6 1 2 3 4 5 6 1 2 3 4 5 5 6 6 1 2 3 4 5 6 2 3 3 4 4 5 5 6 6
wire ( SHORT) : 40 43 42 40 12 11 12 9 10 9 26 27 28 29 29 28 29 27 28 31 31 32 32 32 31 32 32 33 35 38 36 38 35 36 36 37 37 38 41 42 41 41 42 41 61 61 61 61 61 61 60 61 60 61 60 61 48 48 47 47 46 47 46 47 44 44 43 43 42 42 8 6 7 5 6 3 4 3 4
TDC ( INT) : 75 27 36 25 13 47 89 28 120 129 78 126 11 28 160 72 17 93 71 154 32 169 114 34 44 99 89 6 76 108 66 119 155 146 122 121 10 89 16 38 13 7 21 21 25 103 65 65 112 20 147 44 94 89 41 144 44 24 92 145 204 274 277 210 149 112 99 78 64 72 147 267 242 418 95 567 11 92 414
trkDoca ( FLOAT) : -1.0000 -1.0000 -1.0000 -1.0000 0.0731 0.2925 0.5119 0.5119 0.2925 0.0731 1.4833 1.0587 0.3088 2.1009 1.1580 0.2151 1.5826 2.0954 0.7279 0.0055 0.9282 0.4420 0.8785 0.0552 0.9890 0.3812 0.5525 0.8177 1.5174 2.6210 1.0346 1.7244 1.9313 0.5518 1.4485 0.0690 0.4138 1.7933 0.2795 0.4945 0.1290 0.7525 0.6450 0.0215 0.1909 0.4199 0.3054 0.3054 0.4199 0.1909 0.1998 0.4395 0.3197 0.3197 0.4395 0.1998 0.2469 0.0000 0.2469 0.4938 0.7407 1.2345 0.9876 0.9876 0.0000 0.0000 0.0000 0.0000 0.0000 0.0000 0.0199 0.5494 1.3383 1.1486 0.7392 1.6781 0.2096 0.3895 1.4983
docaError ( FLOAT) : 0.2032 0.2032 0.2032 0.2032 0.2032 0.2032 0.2032 0.2032 0.2032 0.2032 0.2032 0.2032 0.2032 0.2032 0.2032 0.2032 0.2032 0.2032 0.2032 0.2032 0.2032 0.2032 0.2032 0.2032 0.2032 0.2032 0.2032 0.2032 0.2032 0.2032 0.2032 0.2032 0.2032 0.2032 0.2032 0.2032 0.2032 0.2032 0.2032 0.2032 0.2032 0.2032 0.2032 0.2032 0.1941 0.1941 0.1941 0.1941 0.1941 0.1941 0.2032 0.2032 0.2032 0.2032 0.2032 0.2032 0.3127 0.3127 0.3127 0.3127 0.3127 0.3127 0.3127 0.3127 0.3311 0.3311 0.3311 0.3311 0.3311 0.3311 0.4701 0.4701 0.4701 0.4701 0.4701 0.4701 0.4701 0.4701 0.4701
LR ( BYTE) : 0 0 0 0 1 1 -1 1 -1 -1 1 1 -1 -1 -1 -1 -1 1 1 -1 1 -1 -1 1 1 -1 1 -1 1 -1 1 -1 1 1 1 1 -1 -1 1 -1 1 1 -1 -1 -1 1 -1 1 -1 1 1 -1 1 -1 1 -1 -1 1 1 1 1 -1 1 -1 -1 -1 -1 -1 -1 -1 1 1 -1 1 -1 1 -1 1 -1
LocX ( FLOAT) : 1.0000 2.0000 3.0000 5.0000 3.0000 4.0000 4.0000 5.0000 5.0000 6.0000 1.0000 2.0000 2.0000 3.0000 4.0000 5.0000 5.0000 6.0000 6.0000 1.0000 2.0000 2.0000 3.0000 4.0000 5.0000 5.0000 6.0000 6.0000 1.0000 1.0000 2.0000 2.0000 3.0000 3.0000 4.0000 4.0000 5.0000 5.0000 1.0000 2.0000 3.0000 4.0000 4.0000 5.0000 1.0000 2.0000 3.0000 4.0000 5.0000 6.0000 1.0000 2.0000 3.0000 4.0000 5.0000 6.0000 1.0000 2.0000 3.0000 4.0000 5.0000 5.0000 6.0000 6.0000 1.0000 2.0000 3.0000 4.0000 5.0000 6.0000 2.0000 3.0000 3.0000 4.0000 4.0000 5.0000 5.0000 6.0000 6.0000
LocY ( FLOAT) : 46.7654 49.6521 49.0748 46.7654 14.4338 12.7017 13.8564 10.9697 12.1244 10.3923 30.5996 31.1769 32.3316 34.0637 33.4863 32.9090 34.0637 31.1769 32.3316 36.3731 35.7957 36.9504 37.5278 36.9504 36.3731 37.5278 36.9504 38.1051 40.9919 44.4560 41.5692 43.8786 40.9919 42.1466 41.5692 42.7239 43.3013 44.4560 47.9201 48.4974 47.9201 47.3427 48.4974 47.9201 71.0141 70.4367 71.0141 70.4367 71.0141 70.4367 69.8594 70.4367 69.8594 70.4367 69.8594 70.4367 56.0030 55.4256 54.8483 54.2709 53.6936 54.8483 53.1162 54.2709 51.3842 50.8068 50.2295 49.6521 49.0748 48.4974 9.2376 7.5056 8.6603 5.7735 6.9282 4.0415 5.1962 3.4641 4.6188
X ( FLOAT) : 0.0000 0.0000 0.0000 0.0000 -71.6639 -73.7759 -72.3679 -75.8878 -74.4799 -76.5918 -51.9523 -51.2483 -49.8404 -47.7284 -48.4324 -49.1364 -47.7284 -51.2483 -49.8404 -44.9125 -45.6164 -44.2085 -43.5045 -44.2085 -44.9125 -43.5045 -44.2085 -42.8005 -39.2806 -35.0567 -38.5766 -35.7606 -39.2806 -37.8726 -38.5766 -37.1686 -36.4646 -35.0567 -30.8327 -30.1287 -30.8327 -31.5367 -30.1287 -30.8327 -1.6736 -2.3461 -1.6736 -2.3461 -1.6736 -2.3461 -4.0813 -3.3773 -4.0813 -3.3773 -4.0813 -3.3773 -24.1981 -25.2812 -26.3643 -27.4474 -28.5305 -26.3643 -29.6136 -27.4474 -34.9155 -36.0625 -37.2095 -38.3565 -39.5035 -40.6506 -158.4696 -163.2955 -160.0383 -168.2414 -164.9842 -173.0673 -169.8101 -174.7560 -171.4987
Z ( FLOAT) : 0.0000 0.0000 0.0000 0.0000 242.3253 243.5380 243.5380 244.7507 244.7507 245.9633 239.9000 241.1127 241.1127 242.3253 243.5380 244.7507 244.7507 245.9633 245.9633 239.9000 241.1127 241.1127 242.3253 243.5380 244.7507 244.7507 245.9633 245.9633 239.9000 239.9000 241.1127 241.1127 242.3253 242.3253 243.5380 243.5380 244.7507 244.7507 239.9000 241.1127 242.3253 243.5380 243.5380 244.7507 229.2365 230.3950 231.5534 232.7119 233.8704 235.0289 239.9000 241.1127 242.3253 243.5380 244.7507 245.9633 353.4097 355.2754 357.1411 359.0069 360.8726 360.8726 362.7383 362.7383 373.7406 375.7163 377.6921 379.6679 381.6437 383.6195 494.7098 497.5153 497.5153 500.3207 500.3207 503.1261 503.1261 505.9315 505.9315
B ( FLOAT) : 0.0000 0.0000 0.0000 0.0000 0.0000 0.0000 0.0000 0.0000 0.0000 0.0000 0.0000 0.0000 0.0000 0.0000 0.0000 0.0000 0.0000 0.0000 0.0000 0.0000 0.0000 0.0000 0.0000 0.0000 0.0000 0.0000 0.0000 0.0000 0.0000 0.0000 0.0000 0.0000 0.0000 0.0000 0.0000 0.0000 0.0000 0.0000 0.0000 0.0000 0.0000 0.0000 0.0000 0.0000 0.0000 0.0000 0.0000 0.0000 0.0000 0.0000 0.0000 0.0000 0.0000 0.0000 0.0000 0.0000 0.0000 0.0000 0.0000 0.0000 0.0000 0.0000 0.0000 0.0000 0.0000 0.0000 0.0000 0.0000 0.0000 0.0000 0.0000 0.0000 0.0000 0.0000 0.0000 0.0000 0.0000 0.0000 0.0000
TProp ( FLOAT) : 0.0000 0.0000 0.0000 0.0000 0.0000 0.0000 0.0000 0.0000 0.0000 0.0000 0.0000 0.0000 0.0000 0.0000 0.0000 0.0000 0.0000 0.0000 0.0000 0.0000 0.0000 0.0000 0.0000 0.0000 0.0000 0.0000 0.0000 0.0000 0.0000 0.0000 0.0000 0.0000 0.0000 0.0000 0.0000 0.0000 0.0000 0.0000 0.0000 0.0000 0.0000 0.0000 0.0000 0.0000 0.0000 0.0000 0.0000 0.0000 0.0000 0.0000 0.0000 0.0000 0.0000 0.0000 0.0000 0.0000 0.0000 0.0000 0.0000 0.0000 0.0000 0.0000 0.0000 0.0000 0.0000 0.0000 0.0000 0.0000 0.0000 0.0000 0.0000 0.0000 0.0000 0.0000 0.0000 0.0000 0.0000 0.0000 0.0000
TFlight ( FLOAT) : 0.0000 0.0000 0.0000 0.0000 0.0000 0.0000 0.0000 0.0000 0.0000 0.0000 0.0000 0.0000 0.0000 0.0000 0.0000 0.0000 0.0000 0.0000 0.0000 0.0000 0.0000 0.0000 0.0000 0.0000 0.0000 0.0000 0.0000 0.0000 0.0000 0.0000 0.0000 0.0000 0.0000 0.0000 0.0000 0.0000 0.0000 0.0000 0.0000 0.0000 0.0000 0.0000 0.0000 0.0000 0.0000 0.0000 0.0000 0.0000 0.0000 0.0000 0.0000 0.0000 0.0000 0.0000 0.0000 0.0000 0.0000 0.0000 0.0000 0.0000 0.0000 0.0000 0.0000 0.0000 0.0000 0.0000 0.0000 0.0000 0.0000 0.0000 0.0000 0.0000 0.0000 0.0000 0.0000 0.0000 0.0000 0.0000 0.0000
clusterID ( SHORT) : -1 -1 -1 -1 1 1 1 1 1 1 2 2 2 2 2 2 2 2 2 3 3 3 3 3 3 3 3 3 4 4 4 4 4 4 4 4 4 4 5 5 5 5 5 5 6 6 6 6 6 6 7 7 7 7 7 7 8 8 8 8 8 8 8 8 9 9 9 9 9 9 10 10 10 10 10 10 10 10 10
trkID ( BYTE) : -1 -1 -1 -1 -1 -1 -1 -1 -1 -1 -1 -1 -1 -1 -1 -1 -1 -1 -1 -1 -1 -1 -1 -1 -1 -1 -1 -1 -1 -1 -1 -1 -1 -1 -1 -1 -1 -1 -1 -1 -1 -1 -1 -1 -1 -1 -1 -1 -1 -1 -1 -1 -1 -1 -1 -1 -1 -1 -1 -1 -1 -1 -1 -1 -1 -1 -1 -1 -1 -1 -1 -1 -1 -1 -1 -1 -1 -1 -1
------------------------+---------------------------+
Clusters
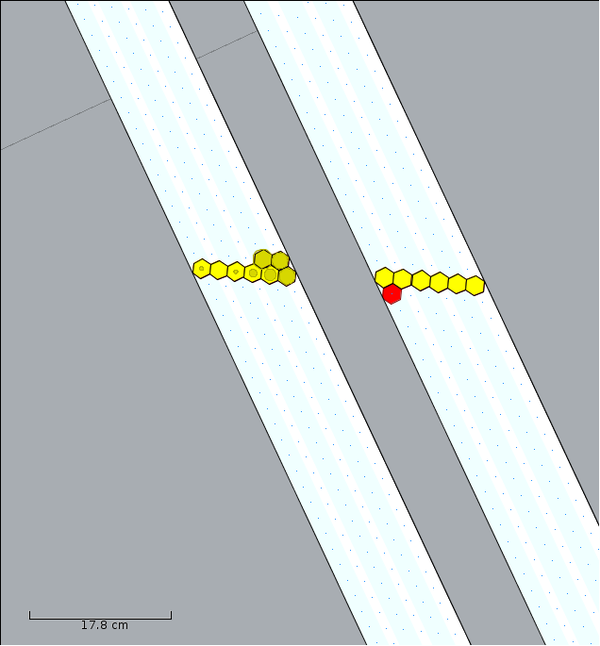
Clusters are collections of hits that are near to one another. In the image below, all of the hits would be included in the cluster. The red one is culled from the group when making the segment for this cluster.
Below is an example of how Clusters are stored in a Hipo file.
 SHOWING BANK
------------------------+---------------------------+
>>>> GROUP (group= 20622) (name=HitBasedTrkg::HBClusters):
------------------------+---------------------------+
          id (   SHORT) :          1         2         3         4         5         6         7         8
      status (   SHORT) :          0         1         0         0         0         0         0         0
      sector (    BYTE) :          2         2         5         5         5         5         5         5
  superlayer (    BYTE) :          1         2         1         2         3         4         5         6
     Hit1_ID (   SHORT) :          1        11        35        43        50        56        63        70
     Hit2_ID (   SHORT) :          2        13        34        42        49        57        65        71
     Hit3_ID (   SHORT) :          3        14        36        44        51        59        64        72
     Hit4_ID (   SHORT) :          4        15        37        45        52        58        66        73
     Hit5_ID (   SHORT) :          6        16        39        46        53        60        67        75
     Hit6_ID (   SHORT) :          7        -1        38        47        54        61        68        74
     Hit7_ID (   SHORT) :         -1        -1        40        48        55        62        69        76
     Hit8_ID (   SHORT) :         -1        -1        41        -1        -1        -1        -1        -1
     Hit9_ID (   SHORT) :         -1        -1        -1        -1        -1        -1        -1        -1
    Hit10_ID (   SHORT) :         -1        -1        -1        -1        -1        -1        -1        -1
    Hit11_ID (   SHORT) :         -1        -1        -1        -1        -1        -1        -1        -1
    Hit12_ID (   SHORT) :         -1        -1        -1        -1        -1        -1        -1        -1
     avgWire (   FLOAT) :    68.6667   77.4000   33.3750   37.4286   29.2857   31.5714   21.8571   23.1429
fitChisqProb (   FLOAT) :     0.0000    0.0036    0.0000    0.0000    0.0000    0.0000    0.0000    0.0000
    fitSlope (   FLOAT) :     0.0166    0.2322   -0.2100   -0.1887   -0.2322   -0.2996   -0.3680   -0.3680
 fitSlopeErr (   FLOAT) :     0.0403    0.0533    0.0348    0.0352    0.0352    0.0400    0.0382    0.0382
   fitInterc (   FLOAT) :     4.4520  -36.5574    9.5149    9.5899   17.7931   49.5027   70.7928   79.1137
fitIntercErr (   FLOAT) :     9.3509   12.9777    8.0593    8.5474   12.5977   15.1560   19.0513   19.9619
        size (    BYTE) :          6         5         8         7         7         7         7         7
------------------------+---------------------------+
Segments
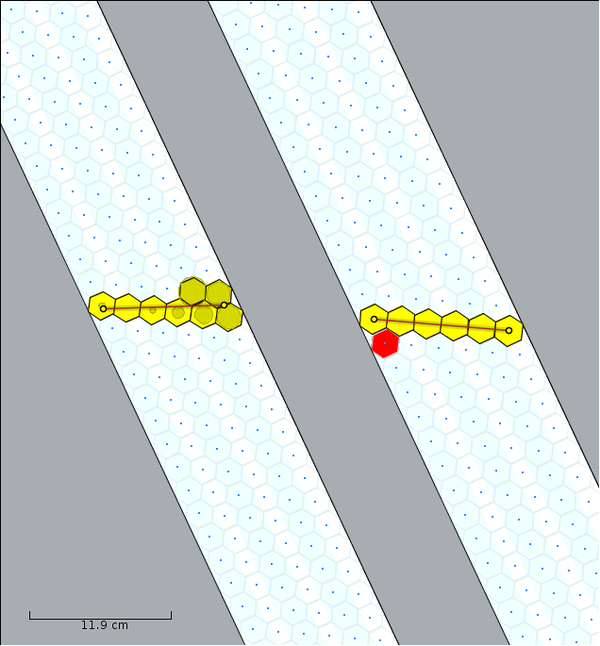
Segments are collections of hits in a single superlayer which have had "bad" hits culled from them. Additionally, a segment also represents a line segment (surprise!) which is a linear approximation of the path of the particle through the superlayer. In the image below, the two segments are represented by the two collections of yellow hexagons. On the left segment you can see the circles which represent the distance of closest approach (doca) of the particle to the wire. The right segment lacks these as there wasn't enough information to answer the left-right ambiguity. Also notice that on the left the line segment is approximately tangential to all of the doca circles.
Below is an example of how Segments are stored in a Hipo file.
 SHOWING BANK
------------------------+---------------------------+
>>>> GROUP (group= 20623) (name=HitBasedTrkg::HBSegments):
------------------------+---------------------------+
          id (   SHORT) :          1         3         5         6         7         8         9        10
      status (   SHORT) :          0         0         0         0         0         0         0         0
      sector (    BYTE) :          1         1         1         3         3         3         3         3
  superlayer (    BYTE) :          2         2         2         1         2         3         4         5
  Cluster_ID (   SHORT) :          1         3         5         6         7         8         9        10
     Hit1_ID (   SHORT) :         56        94        98         1         7        13        21        32
     Hit2_ID (   SHORT) :         54        92       124         2         8        14        23        34
     Hit3_ID (   SHORT) :         55       130       100         3         9        15        24        33
     Hit4_ID (   SHORT) :         52       132       101         4        10        16        25        36
     Hit5_ID (   SHORT) :         53       133       115         5        11        18        26        35
     Hit6_ID (   SHORT) :         50        81       116         6        12        17        27        39
     Hit7_ID (   SHORT) :         -1        87        -1        -1        -1        20        -1        38
     Hit8_ID (   SHORT) :         -1       134        -1        -1        -1        19        -1        41
     Hit9_ID (   SHORT) :         -1        88        -1        -1        -1        -1        -1        40
    Hit10_ID (   SHORT) :         -1        -1        -1        -1        -1        -1        -1        -1
    Hit11_ID (   SHORT) :         -1        -1        -1        -1        -1        -1        -1        -1
    Hit12_ID (   SHORT) :         -1        -1        -1        -1        -1        -1        -1        -1
     avgWire (   FLOAT) :    10.5000   31.7778   41.3333   61.0000   60.5000   47.0000   43.0000    5.1111
fitChisqProb (   FLOAT) :     0.0019    0.0000    0.0000    0.0027    0.0027    0.0000    1.0000    0.0000
    fitSlope (   FLOAT) :    -1.4249    0.2107   -0.0625   -0.0498    0.0498   -0.4354   -0.5805   -1.3945
 fitSlopeErr (   FLOAT) :     0.0719    0.0321    0.0512    0.0403    0.0403    0.0344    0.0403    0.0427
   fitInterc (   FLOAT) :   273.7628  -95.4594  -15.5529    9.5410  -15.8175  129.4050  182.0523  531.4352
fitIntercErr (   FLOAT) :    17.5424    7.8094   12.4168    9.3509    9.7859   12.3491   15.2542   21.4032
SegEndPoint1X (   FLOAT) :    39.6847   60.6765   73.6974   95.1886   97.8695  127.1811  126.3054   67.8422
SegEndPoint1Z (   FLOAT) :   246.1951  236.4065  230.3347  208.5473  219.0631  330.6389  353.4799  511.1211
SegEndPoint2X (   FLOAT) :    34.4168   64.3967   75.9163   97.3753  100.7054  127.4424  125.2827   56.0423
SegEndPoint2Z (   FLOAT) :   255.3417  241.3618  235.9901  213.9188  224.4308  340.8101  364.8570  532.1007
        size (    BYTE) :          6         9         6         6         6         8         6         9
------------------------+---------------------------+
Crosses
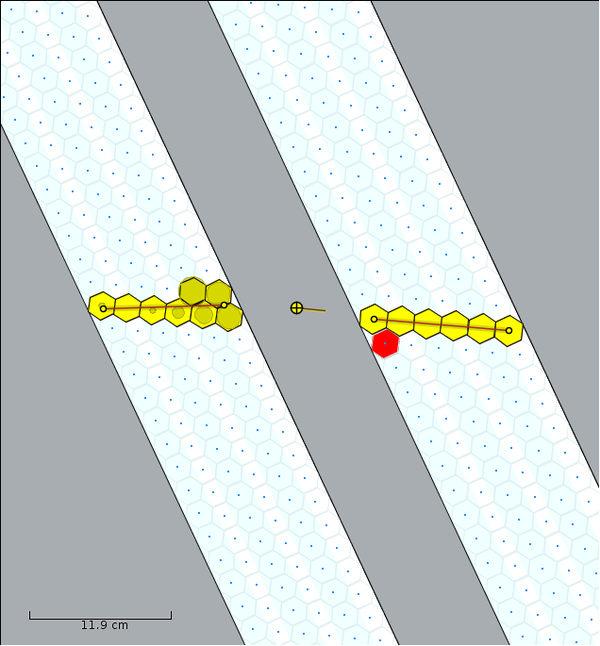
Crosses represent a point in space between two superlayers and an associated direction vector. The point is found by taking the average of two points on the midplane between the two superlayers. Those two points are defined by the intersection of the midplane with the lines defined by the Segments. The direction vector is more complicated and can be understood by studying the code below.
        double z = DcDetector.getRegionMidpoint(this.get_Region() - 1).z;

        double wy_over_wx = (Math.cos(Math.toRadians(6.)) / Math.sin(Math.toRadians(6.)));
        double val_sl1 = this._seg1.get_fittedCluster().get_clusterLineFitSlope();
        double val_sl2 = this._seg2.get_fittedCluster().get_clusterLineFitSlope();
        double val_it1 = this._seg1.get_fittedCluster().get_clusterLineFitIntercept();
        double val_it2 = this._seg2.get_fittedCluster().get_clusterLineFitIntercept();

        double x = 0.5 * (val_it1 + val_it2) + 0.5 * z * (val_sl1 + val_sl2);
        double y = 0.5 * wy_over_wx * (val_it2 - val_it1) + 0.5 * wy_over_wx * z * (val_sl2 - val_sl1);

        this.set_Point(new Point3D(x, y, z));

        double tanThX = val_sl2;
        double tanThY = FastMath.atan2(y, z);
        double uz = 1. / Math.sqrt(1 + tanThX * tanThX + tanThY * tanThY);
        double ux = uz * tanThX;
        double uy = uz * tanThY;

        Point3D dirVec = new Point3D(ux, uy, uz);
        this.set_Dir(dirVec);
The image below shows the cross from the image above.
Below is an example of how Crosses are stored in a Hipo file.
 SHOWING BANK
------------------------+---------------------------+
>>>> GROUP (group= 20625) (name=HitBasedTrkg::HBCrosses):
------------------------+---------------------------+
          id (   SHORT) :          1         2         3         4         5
      status (   SHORT) :          0         0         0         0         0
      sector (    BYTE) :          3         3         3         6         6
      region (    BYTE) :          1         2         3         1         1
           x (   FLOAT) :    -0.3618  -11.9840  -56.9372  -68.7670  -65.6416
           y (   FLOAT) :    32.3521   55.8878   59.5648    7.2446  -22.4919
           z (   FLOAT) :   237.4644  368.2394  510.0512  237.4644  237.4644
       err_x (   FLOAT) :     0.1643    0.2976    0.3015    0.1788    0.2135
       err_y (   FLOAT) :     1.5629    2.8317    2.8681    1.7015    2.0310
       err_z (   FLOAT) :     0.0000    0.0000    0.0000    0.0000    0.0000
          ux (   FLOAT) :     0.0492   -0.2238   -0.4260    0.2261    0.2252
          uy (   FLOAT) :     0.1340    0.1452    0.1045    0.0297   -0.0916
          uz (   FLOAT) :     0.9898    0.9638    0.8987    0.9737    0.9700
      err_ux (   FLOAT) :     0.0401    0.0361    0.0529    0.0273    0.0404
      err_uy (   FLOAT) :     0.3828    0.3286    0.2649    0.2079    0.2514
      err_uz (   FLOAT) :     0.0014    0.0518    0.0726    0.0908    0.1186
 Segment1_ID (   SHORT) :          1         3         5         7         8
 Segment2_ID (   SHORT) :          2         4         6        10        10
------------------------+---------------------------+
Tracks
Tracks represent the culmination of the entire reconstruction chain. Importantly, they include the reconstructed interaction vertex, momentum at that vertex, and the charge of the particle. They also contain some basic information about the crosses from which the interaction vertex was reconstructed and some statistical data about the fit.
Below is an example of how Tracks are stored in a Hipo file.
 SHOWING BANK
------------------------+---------------------------+
>>>> GROUP (group= 20626) (name=HitBasedTrkg::HBTracks):
------------------------+---------------------------+
          id (   SHORT) :          1
      status (   SHORT) :        100
      sector (    BYTE) :          3
        c1_x (   FLOAT) :  -128.5109
        c1_y (   FLOAT) :   115.4666
        c1_z (   FLOAT) :   506.9086
       c1_ux (   FLOAT) :     0.0032
       c1_uy (   FLOAT) :    -0.0799
       c1_uz (   FLOAT) :    -0.9968
        c3_x (   FLOAT) :  -128.7847
        c3_y (   FLOAT) :   120.8905
        c3_z (   FLOAT) :   574.3513
       c3_ux (   FLOAT) :    -0.0045
       c3_uy (   FLOAT) :     0.0802
       c3_uz (   FLOAT) :     0.9968
        t1_x (   FLOAT) :   -57.5850
        t1_y (   FLOAT) :    45.6473
        t1_z (   FLOAT) :   166.7499
       t1_px (   FLOAT) :    -0.3076
       t1_py (   FLOAT) :     0.2565
       t1_pz (   FLOAT) :     0.7588
      Vtx0_x (   FLOAT) :    -2.2362
      Vtx0_y (   FLOAT) :    -1.3091
      Vtx0_z (   FLOAT) :    28.8956
        p0_x (   FLOAT) :    -0.1872
        p0_y (   FLOAT) :     0.3537
        p0_z (   FLOAT) :     0.7590
   Cross1_ID (   SHORT) :          1
   Cross2_ID (   SHORT) :          2
   Cross3_ID (   SHORT) :          3
           q (    BYTE) :         -1
  pathlength (   FLOAT) :   583.9297
        chi2 (   FLOAT) :  9557.5850
         ndf (   SHORT) :         27
------------------------+---------------------------+
Trajectories
Below is an example of how Trajectories are stored in a Hipo file.
 SHOWING BANK
------------------------+---------------------------+
>>>> GROUP (group= 20653) (name=TimeBasedTrkg::Trajectory):
------------------------+---------------------------+
         tid (   SHORT) :          1         1         1         1         1         1         1         1         1         1         1         1         1         1         1         1         1         1         0
         did (   SHORT) :          0         1         2         3         4         5         6        12        18        24        30        36        42        43        45        46        47        48         0
           x (   FLOAT) :    -9.9529   -3.7311   -3.7962   -3.8596   -3.9212   -3.9789   -4.0374  -13.2187  -13.7865  -18.8099  -19.4285  -22.3313  -22.9000  -25.2570  -26.2660  -26.6888  -27.0723  -27.9423    0.0000
           y (   FLOAT) :   -50.6146  -11.4803  -11.8263  -12.1727  -12.5193  -12.8522  -13.1992  -68.0507  -71.0887 -100.0908 -103.8051 -117.5637 -119.6376 -128.3220 -132.0461 -133.6067 -135.0220 -138.2330    0.0000
           z (   FLOAT) :   167.2291   30.3110   31.5104   32.7099   33.9094   35.0609   36.2604  228.7963  239.5100  355.4784  376.8500  505.6019  529.8580  631.0645  674.4456  692.6249  709.1107  746.5151    0.0000
          tx (   FLOAT) :    -0.0506   -0.0528   -0.0514   -0.0500   -0.0487   -0.0474   -0.0462   -0.0510   -0.0508   -0.0305   -0.0266   -0.0234   -0.0233   -0.0232   -0.0232   -0.0232   -0.0232   -0.0232    0.0000
          ty (   FLOAT) :    -0.2722   -0.2767   -0.2769   -0.2772   -0.2774   -0.2775   -0.2777   -0.2723   -0.2726   -0.1825   -0.1599   -0.0850   -0.0853   -0.0855   -0.0855   -0.0855   -0.0855   -0.0855    0.0000
          tz (   FLOAT) :     0.9609    0.9595    0.9595    0.9595    0.9595    0.9595    0.9596    0.9609    0.9608    0.9827    0.9868    0.9961    0.9961    0.9961    0.9961    0.9961    0.9961    0.9961    0.0000
           B (   FLOAT) :     0.0000    0.0000    0.0000    0.0000    0.0000    0.0000    0.0000    0.0000    0.0000    0.0000    0.0000    0.0000    0.0000    0.0000    0.0000    0.0000    0.0000    0.0000    0.0000
           L (   FLOAT) :   185.6421   43.1024   44.3525   45.6025   46.8526   48.0527   49.3027  249.7139  260.8645  380.5711  402.2723  531.8295  556.1809  657.7866  701.3390  719.5900  736.1409  773.6930    0.0000
------------------------+---------------------------+
