BriansRanLogbook
This is where I write down what I'm doing
1/13/23 : Turned on HpGe HV to 1500 and learned about analog to digital signal processing
detected signal rate -vs- HpGe Voltage
HpGe Detector
| High Voltage (V) | Counts (with source) | Counts (no source) |
|---|---|---|
| 1492.67 | 1532.5 ± 36.67 | 167.5 ± 7.78 |
| 799.15 | 1336.5 ± 2.12 | 149.4 ± 34.65 |
| 396.83 | 1193.5 ± 54.48 | 127.5 ± 7.78 |
| 197.19 | 1035.5 ± 40.31 | 121 ± 4.24 |
| 4.88 | 562.5 ± 2.12 | 332 ± 35.36 |

05/02/2023 Amplifier Course Gain: 2 High Voltage: 1500V
run 7342 7343 Disc Thresh:0.588V

run 7344 7345 Disc Thresh: 0.500V

run 7346,7347 Disc Thresh: 0.425V

run 7348 7349 Disc Thresh: 0.351V

run 7351 7532 Cs-137 source, Disc Thresh: 0.306V

run 7354 EU-152 source Disc Thresh: 0.306V

He3 Tube
1/27/23 : Turned on He3 detector, adjusted to find counts with Cf source in containment and out of containment
2/3/23 : Same as 1/27, adjusting discriminator voltage and recording counts with Cf-252 source. Encountered strange effects of higher counts with source away at low QD voltage. Sets of measurements notably inconsistent.
| Discriminator Voltage (V) | Counts/10s (no source) | Counts/10s (with source) |
|---|---|---|
| 2.003 | 4.4 ± 1.67 | 97.0 ± 8.49 |
| 1.788 | 4.8 ± 1.09 | 108.2 ± 10.89 |
| 1.503 | 5.4 ± 2.22 | 105.7 ± 8.63 |
| 1.227 | 7.9 ± 3.14 | 109.8 ± 9.34 |
| 1.009 | 89.9 ± 7.87 | 234.1 ± 20.06 |
| 0.799 | 2656 ± 251.1 | 2447 ± 183.0 |
| 0.485 | 55479 ± 1325 | 48360 ± 1938 |

2/10/23 Same procedure as 2/3/23, just changing HV applied to He3 detector to values of 1300V then 1100V.
| Discriminator Voltage (V) | Counts/10s (no source) | Counts/10s (with source) |
|---|---|---|
| 1.971 | 4.6 ± 2.37 | 107.7 ± 13.17 |
| 1.775 | 7.7 ± 2.11 | 100 ± 10.70 |
| 1.486 | 5.5 ± 2.32 | 104.8 ± 12.79 |
| 1.248 | 4.7 ± 2.00 | 99.6 ± 7.09 |
| 1.013 | 75.2 ± 12.17 | 171 ± 12.82 |
| 0.762 | 3074 ± 143.0 | 2833 ± 894.7 |
| 0.509 | 19658 ± 424.6 | 40290 ± 2402 |

| Discriminator Voltage (V) | Counts/10s (no source) | Counts/10s (with source) |
|---|---|---|
| 1.971 | 5.4 ± 1.78 | 111.3 ± 9.97 |
| 1.773 | 5.3 ± 1.89 | 97.3 ± 7.70 |
| 1.524 | 7.1 ± 4.51 | 99.7 ± 11.78 |
| 1.275 | 12.2 ± 3.55 | 117.3 ± 23.11 |
| 0.993 | 177.7 ± 8.18 | 351.9 ± 28.71 |
| 0.784 | 2691.2 ± 114.7 | 2763.7 ± 126.2 |
| 0.485 | 50346 ± 3831 | 53920 ± 4354 |

03/31/2023
- Analyzed the plateau graphs.
- Began taking plateau measurements between a discriminator voltage range of about 1.000V and 1.250V to determine where the noise is cut from the signal.
- Got abnormal fluctuations in counts.
Compton_Michelle.txt
04/04/2023
- Worked with Dr. Forest to tune the He3 detector such that the peak height of the signal could be read by the computer.
- Set up the computer to read from the peak sensing ADC and start taking measurements.
- Started a background measurement to run overnight.
04/05/2023
- Ended the background measurement.
- Took a new measurement, this time with source out.
04/07/2023
- Worked with Dr. Forest to graph the two measurements and to create a graph of the source out measurement minus the background measurement.
- Began re-tuning the detector in order to repeat the process once more.
04/11/2023
- Finished tuning the detector and took another source out measurement. The discriminator threshold this time was at 3.660V.
- Completed a second background measurement.
04/12/2023
- Started a new plateau measurement by taking a measurement with the source out and viewing the graph in root.
- Since the He3 detector was readjusted the new point where noise is cut from the signal has shifted, after some measurements it was determined to now be somewhere between 1.900 and 2.000 instead of the window from 03/31/2023.
- Took a source out measurement at a discriminator threshold 1.900V.
04/18/2023
- Before starting measurements the GUI displayed an error "Lost Connection to the Platform." Had to restart the process.
- After adjusting the discriminator threshold to 1.927V and taking a source out measurement, the data file produced no results when graphing the data in ROOT. Was unable to determine the reason for this. It's possible the width of the logic pulse was accidentally adjusted while while changing the disc voltage or that some adjustment was made to their position so that the computer does not have enough time to read out the measurement. Will check the detector is correctly adjusted and ask Dr. Forest when he returns if that is not the problem.
04/19/2023
- Was unable to determine the reason that the data file was reading out incorrectly. Will have to wait for Dr. Forest to help understand and fix the problem.
- Attempted to start creating background subtracted graphs in ROOT for the measurements already taken.
04/20/2023
- Finished the background subtracted graphs.
- Looked at the peak sensing ADC one more time without success.
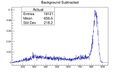
Background subtracted graph for discriminator threshold 3.114V
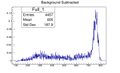
Background subtracted graph for discriminator threshold 3.660V


05/01/2023
- Tried to start another measurement on the He-3 tube but the computer gave a similar error as before. Attempted to find the source of the problem but was unsuccessful.
05/02/2023
- With Dr. Forests help, I was able to determine that the problem was that the peak sensing ADC was incorrectly configure to r1dc when it should be PAA.
- Worked with Dr. Forest to start changing the electronics from the He-3 tube to the HpGe. This was done by sending the signal of from the HpGe through the fan in/fan out and then through a timing filter amplifier. The signal was then sent back through the fan in/fan out where one out was sent to the spec amp and the other was sent to the discriminator. The spec amp signal was plugged into channel 9 on the ADC and the discriminator pulse was sent to a dual timer and from there to gate delay generator and the gate port of the ADC.
- The outputs from the dual timer, the gate delay generator, and bipolar spec amp were sent to the oscilloscope to calibrate the HpGe detector by aligning the peak of the pulse created by spec amp inside the pulse created by the dual timer. This tells the computer to measure the peak. Then the pulse created by the gate delay generator was moved about 6 microseconds away from the dual timer pulse as specified by CAEN V785N ADC manual. This tells the computer to take the measurement and read it out to the data file. The reason for being set 6 microseconds away was to give the computer enough time to measure the pulse and store it.
- Took some source in/source out data with the Cs-137 source on the HpGe detector and created the background subtracted graphs in root.
- Reset the electronics back to the He-3 detector by myself and took a source in measurement using the Cf-252 source.
05/03/2023
- Examined the background subtracted graphs with Dr. Forest and learned about the ADC channel's relation to the energy to the emitted photons.
- Reset the electronics back to the HpGe detector and calibrated the signal so it could be read out by the peak sensing ADC. Calibrated the HpGe detector by taking Eu-152 source and taking a source in measurement. We then attempted to use Connor Harper code to calibrate the ADC channel number to the photon energy in keV.
- Took a source in measurement on the HpGe detector using the Cs-137 source and attempted to calibrate it with Connor's code but for an unknown reason the peak was not calibrated to the correct energy. We then used a linear method of calibrating the peak that was created by Dr. Forest. Will look into Connor's code in the future and try to determine the source of the problem
- Using Dr. Forest's method, we were able to calibrate the peak to about the correct energy with some minor error.
05/05/2023
- Met with Dr. Dale to learn about the new project called SPECT which is interested in creating Cu-67 by knocking out an alpha particle from Ga-71.
- Began testing scintillators attached to photo-multiplier tubes the oscilloscope to determine which ones worked and which ones did not or had a light leak problem. The scintilators were hooked up to a high voltage power supply at about 1200 V and connected to the oscilloscope. The Cs-137 source was brought close to the scintillators to see if any difference in the background signal from the source in signal could be seen. At first no signal was seen until the trigger was adjusted but the source in source out signals were not distinguishable on the oscilloscope.
05/08/2023
- Started by doing a coincidence experiment using two plastic scintillators, Jacinda and Michele. We placed the wider one, Jacinda, on a table and connected it to a high voltage power supply at about 1200V as well as the oscilloscope on scope 3.
- Michelle, the thinner scintillator, was connected to another high voltage power supply at about 1050V and connected to scope 4 on the oscilloscope. Both power supplies had negative polarity. Michelle was held above Jacinda and the scope was used to observe coincidence counts. It did appear that we were may have been receiving more pulses through Jacinda that did not pass through Michelle than expected.
- Next, Michelle was connected to a discriminator and sent to a scalar. At the discriminators lowest setting of 0.306V, no counts from background sources were observed. A Cs-137 source was brought close to the scintillator and no counts were observed. We then tried sending Michelle's signal through a spec amp and timing filter amp and then through the discriminator and scalar. Doing this did cause the source in/source out signals to become distinguishable.
- Tried again to send Michelle directly to a discriminator unamplified with a high voltage of 1000V and did observe background counts. The error was likely due to sending the signal through an timing filter amp unnecessarily. The Cs-137 source was brought close to the scintillator again and a noticeable difference in counts between the source in/source out signals was observed.
| Source in counts (Hz) | Source out counts (Hz) |
|---|---|
| 112 | 2 |
| 105 | 2 |
| 103 | 2 |
| 122 | 2 |
| 99 | 3 |
| 128 | 3 |
| 98 | 5 |
| 117 | 4 |
| 127 | 1 |
| 117 | 0 |
| Average: 112 ± 11.15 | Average: 2.4 ± 1.43 |
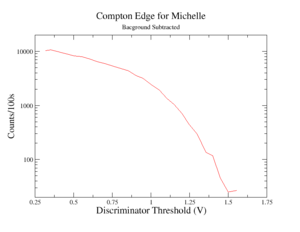
- Began trying to find the Compton Edge of the Michelle scintillator by turning up the discriminator in intervals of about 0.5 V and measuring the source in/source out counts at each interval until the counts dropped to about zero after subtracting the background
- The discriminator voltages recorded here are the voltages as measured by the multimeter. The discriminator itself has a ten-to-one ratio, thus all recorded voltages should be divided by 10 in order to obtain the true threshold.
| Disc Threshold (V) | Source In (counts/100s) | Source Out (Counts/100s) | Ratio (Source In/Source Out) |
|---|---|---|---|
| 0.318 V | 10578 | 271 | 39.0332 |
| 0.354 V | 10837 | 262 | 41.3626 |
| 0.410 V | 9908 | 234 | 42.3418 |
| 0.450 V | 9198 | 213 | 43.1831 |
| 0.503 V | 8473 | 210 | 40.3476 |
| 0.554 V | 8152 | 183 | 44.5464 |
| 0.604 V | 7342 | 154 | 47.6753 |
| 0.653 V | 6609 | 159 | 41.5660 |
| 0.702 V | 6076 | 158 | 38.4557 |
| 0.755 V | 5427 | 139 | 39.0432 |
| 0.805 V | 4943 | 140 | 35.3071 |
| 0.854 V | 4500 | 124 | 36.2903 |
| 0.904 V | 3686 | 130 | 28.3538 |
| 0.950 V | 3289 | 131 | 25.1068 |
| 1.004 V | 2533 | 112 | 22.6161 |
| 1.055 V | 2046 | 126 | 16.2381 |
| 1.104 V | 1464 | 108 | 13.5556 |
| 1.149 V | 1148 | 112 | 10.2500 |
| 1.201 V | 825 | 118 | 6.9915 |
| 1.249 V | 553 | 108 | 5.1204 |
| 1.299 V | 385 | 87 | 4.4253 |
| 1.355 V | 230 | 94 | 2.4468 |
| 1.400 V | 210 | 91 | 2.3077 |
| 1.450 V | 135 | 89 | 1.5167 |
| 1.500 V | 111 | 86 | 1.2907 |
| 1.555 V | 109 | 82 | 1.3293 |

05/09/2023
- Started taking measurements to find the Compton for another unnamed plastic scintillator at a high voltage of 1000V. The unnamed scintillator had a light leak problem so it was not completed.
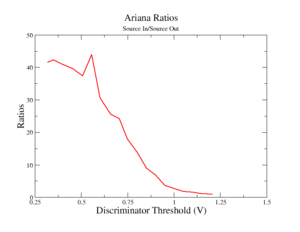
- Started taking measurements to find the Compton edge of the Ariana scintillator at a high voltage of 1000V.
| Disc Thresh (V) | Source In (counts/100s) | Source Out (counts/100s) | Ratio (Source In/Source Out) |
|---|---|---|---|
| 0.320 V | 9520 | 229 | 41.5721 |
| 0.352 V | 8869 | 210 | 42.2333 |
| 0.401 V | 8016 | 196 | 40.8980 |
| 0.454 V | 7321 | 185 | 39.5730 |
| 0.508 V | 6458 | 173 | 37.3295 |
| 0.556 V | 5712 | 130 | 43.9385 |
| 0.601 V | 4770 | 156 | 30.5769 |
| 0.658 V | 3866 | 151 | 25.6026 |
| 0.705 V | 2860 | 118 | 24.2373 |
| 0.749 V | 2280 | 127 | 17.9528 |
| 0.803 V | 1496 | 109 | 13.7248 |
| 0.852 V | 1036 | 116 | 8.9310 |
| 0.900 V | 690 | 100 | 6.900 |
| 0.950 V | 406 | 111 | 3.6576 |
| 1.001 V | 265 | 99 | 2.6768 |
| 1.052 V | 171 | 95 | 1.8000 |
| 1.105 V | 129 | 86 | 1.5000 |
| 1.154 V | 98 | 96 | 1.0208 |
| 1.206 V | 89 | 95 | 0.9368 |

Calculation of the Compton Scattering Energies
To equation for Compton scattering is given below
Where is the energy of the incoming photon, is the energy of the recoiling photon, is the energy of the electron at rest, and is the scattering angle. For our Cs-137 source, the energy of the incoming photon is 661.7 keV and the scattering angle is 180°. Thus, we obtain
By conservation of energy we have
Since we are assuming the electron is at rest initially, then will be the rest energy of the electron. To get the momentum energy of the recoiling electron,
So the momentum energy of the recoiling electron will be .
05/11/2023
- Started a coincidence measurement by placing the active area of Michelle on top of Ariana. The signal for each was sent through a discriminator and then through a dual delay. The delay was adjusted until the pulse from each detector was directly aligned with each other. The pulses were sent through a three fold logic unit on the "and" setting and then the output was sent to a scalar.
- Built the coincidence detector stand using parts from Dr. Dales lab.

| Michelle Discriminator Threshold (V) | Counts/300s |
|---|---|
| 0.418 V | 79 |
| 0.454 V | 86 |
| 0.508 V | 86 |
| 0.554 V | 84 |
| 0.598 V | 80 |
| 0.658 V | 90 |
| 0.713 V | 72 |
| 0.754 V | 77 |
| 0.804 V | 63 |
| 0.858 V | 92 |
| 0.903 V | 61 |
| 0.951 V | 80 |
| 1.007 V | 67 |
| 1.500 V | 64 |
| 2.006 V | 81 |
| 2.110 V | 71 |
| 2.206 V | 62 |
| 2.302 V | 54 |
| 2.399 V | 53 |
| 2.505 V | 49 |
| 2.601 V | 32 |
| 2.709 V | 41 |
| 2.800 V | 30 |
| 2.912 V | 28 |
| 3.012 V | 20 |
| 3.108 V | 19 |
| 3.200 V | 15 |
| 3.305 V | 13 |
| 3.399 V | 16 |
| 3.502 V | 22 |
| 3.605 V | 7 |
| 3.700 V | 12 |
| 3.800 V | 16 |
| 3.898 V | 12 |
| 4.012 V | 9 |
| 4.111 V | 7 |
| 4.204 V | 7 |
| 4.304 V | 5 |
| 4.417 V | 9 |
| 4.499 V | 3 |
| 4.600 V | 6 |
| 4.709 V | 5 |
| 4.805 V | 8 |
| 4.911 V | 6 |
| 5.012 V | 2 |
05/15/2023
- Did a test by taking the Ariana and Michelle sicnitillators at a high voltage of 1000 V and a discriminator voltage of about 0.420 V and separating them. Ariana was placed on a surface with its active area about 21.25 inches from the active area of the Michelle scintillator directly below on a table. In intervals of about 5 minutes only about 1-4 coincidence counts were detected.
- Next, the Ariana scintillator above was moved approximate 12 inches to the right in order to try and determine if any angular distribution cosmic rays exist. Thus the total distance between the active areas is about 24.4 inches. In 5 minute intervals about 0-1 counts were detected but more frequently 0 counts. These counts could be due to showers or cosmic rays coming in an angle but it appears that angular distributed particles are less common then those traveling straight down between the detectors. Longer intervals would be needed to confirm this.
05/16/2023
- Set up the detectors in a similar manner as yesterday with the active area of Ariana being approximately 21.25 in from the live area of Michelle and both at a high voltage of 1000 V. The discriminator threshold for Ariana was 0.421 V and the threshold for Michelle was 0.436 V. Will let the detector sit for approximately 24 hours and return to record the counts. Started the run at 11:55:15.
05/17/2023
- Returned at 12:18:25. The total time is thus is 24 hours, 23 minutes, and 10 seconds. The total counts was 404.
- Moved the Ariana scintillator about 14 inches to the right while still being 21.25 inches above making the total distance abut 25.4 inches. Started a new run at 12:27:20 and will again return in 24 hours to record the counts.
05/18/2023
- Returned at 1:22:05. The total time is thus 24 hours 54 minutes and 45 seconds and the total counts was 211.
- Moved the Ariana scintillator to about 28 inches to the right of the active are while still about 21.25 inches above. Thus the total distance between the live areas is about 35.15 inches. Started a new run at 13:31:30 and will return again in about 24 hours.
05/19/2023
- Returned at 13:35:00. The total time of the run is thus 24 hours 3 minutes and 30 seconds. The total counts was 64. These measurements fall in line with our expectations and tells about how many counts we should expect.
- Finished making the background subtracted graphs for the Cs-137 source for the high purity germanium detector. Also uploaded the source in graph for the Eu-152 source.