Faraday Cup Analysis
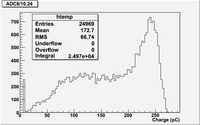
FC analysis using ADC channel current distribution
For each ADC channel:
For distribution over all ADC channel:
???
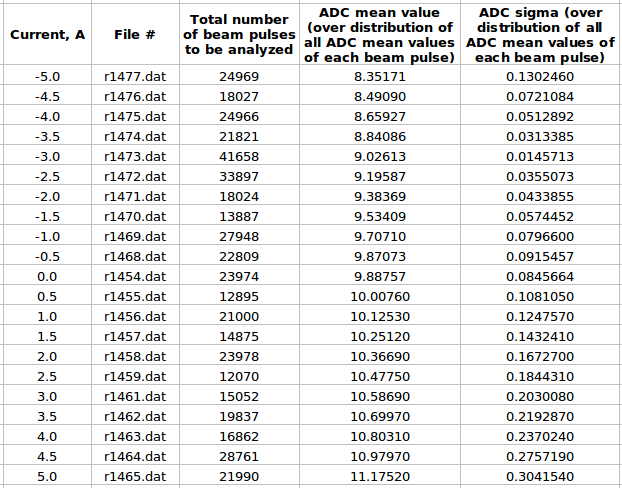
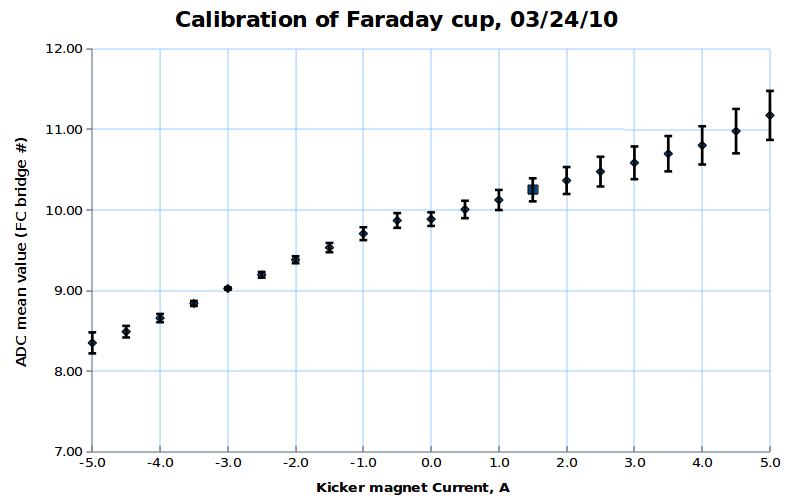
FC analysis using pulse by pulse ADC channel mean value distribution
For each beam pulse:
For distribution over all beam pulses:
Here is:
1. ADC# = bridge#
2. Pulse# = ReadOut# = Entry# = Event#
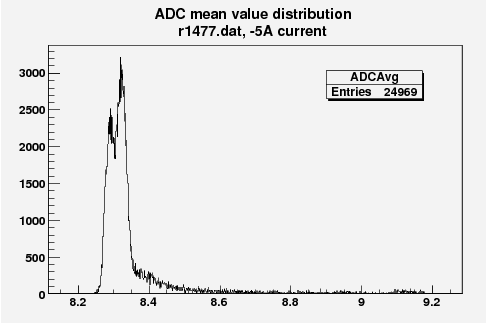
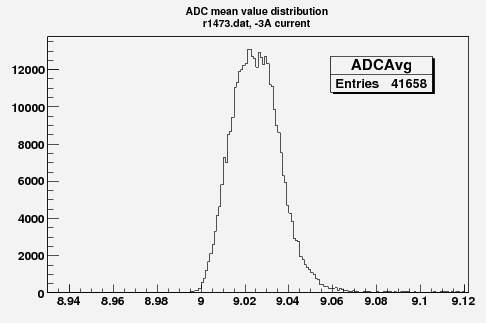
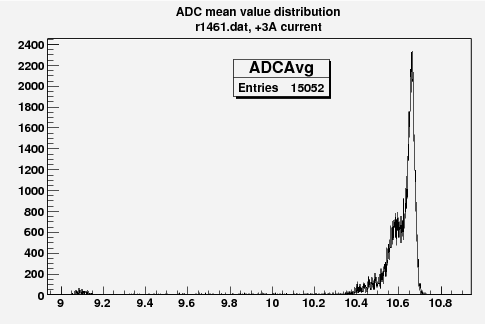
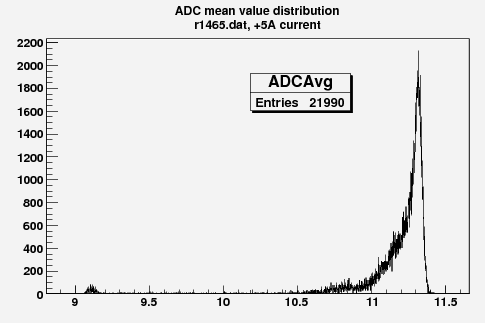
Some examples of ADC mean value distribution. Here are:
1. x axis: ADC mean value for one pulse
2. y axis: number of pulse w/ that ADC mean value
Faraday Cup 3D plot
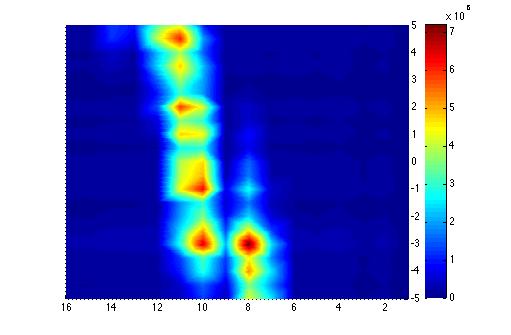
Below is the plot of the charge in Faraday cup (pC) as a function of magnet current (vertical axis, A) (basically magnetic field) and ADC (horizontal axis).
Faraday Cup ADC channel distribution
Faraday Cup "Rain"
Error Analysis
The ADC measures the charge deposited on each of the 16 Aluminum blocks. The ADC is a 12 bit ADC with a max input of 400 pc. THe means that the charge per channel is:
Run1477 -5A
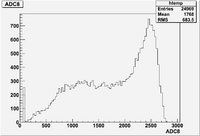
Raw ADC result for channel 8 :
ADC 8 using channel -> Coul conversion:
