Mlr Summ TF
VanWasshenova_Thesis#Mlr_Summ_TF
Moller Summary
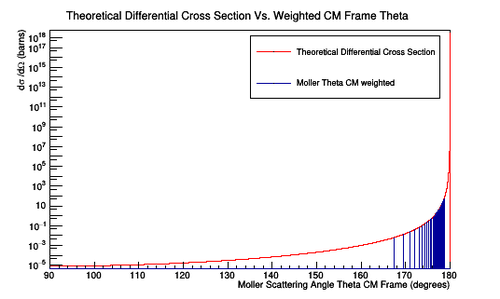
Scattering Xsect
As derived earlier, in the Differential_Cross-Section section
In the Ultra-relativistic limit as
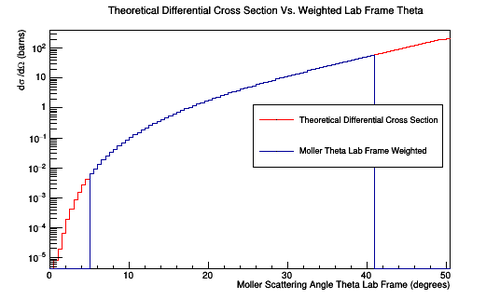
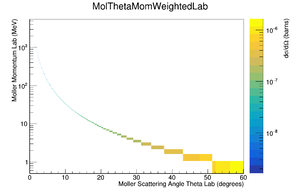
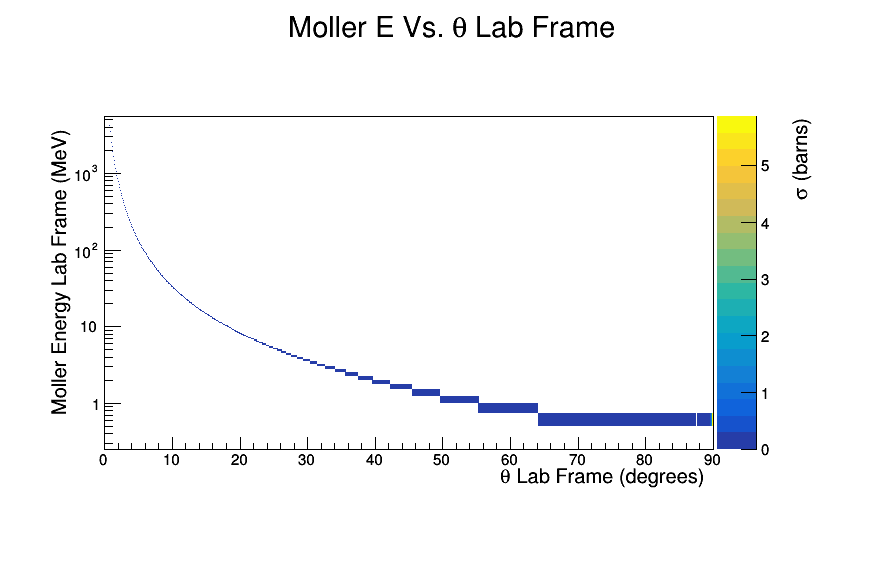
Weight the E-vs-Theta plot with Xsect
Moller electron radius -vs- Momentum (Full solenoid and relativistic)
Baseline
Moller events using an lH2 target geometry No Raster
DC hits -vs- Solenoid
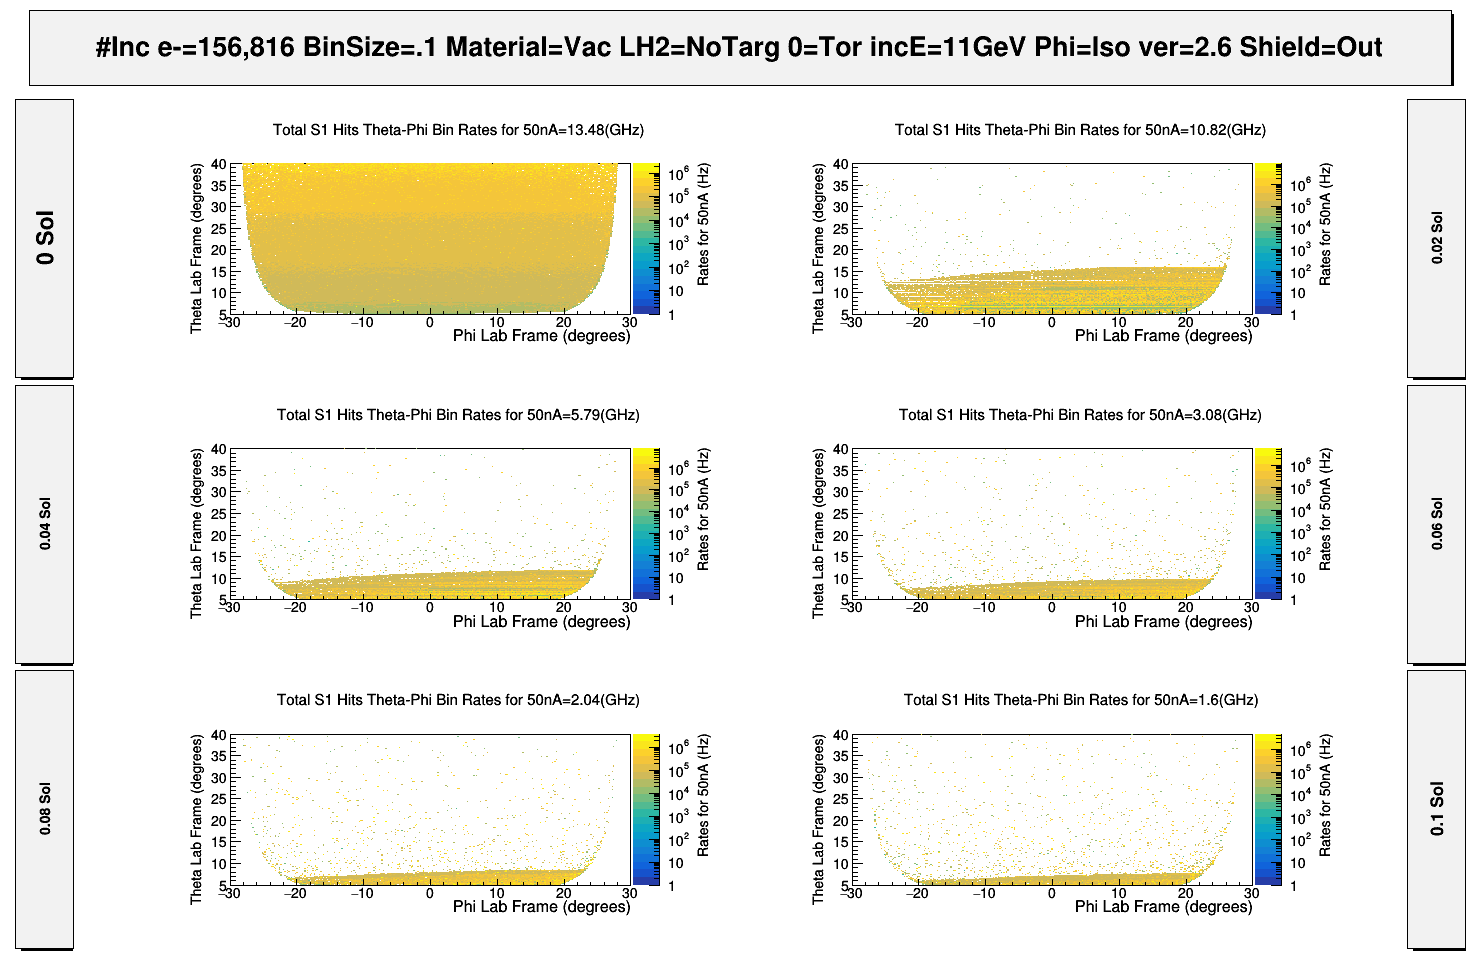
Starting the clas12 Moller simulation with a simple configuration, most components downstream with respect to the drift chambers are taken out of the gcard file. The remaining components, the Drift Chamber (DC), the Solenoid, and the Magnetic Components (CAD) are all that remain as shown below. The Torus field is held at zero Tesla, and the Solenoid field strength is increased from 0 to it's max of 5T.
As the Solenoid field strength increases, the Moller electrons are forced to into a helical path of decreasing radius, effectively "rotating" off the DC face. The relative value of the field changes the direction field, which in turn causes slightly more hits to be deposited on one side versus the other. This effect is only noticeable in that the neighboring sectors to S1 were not simulated.
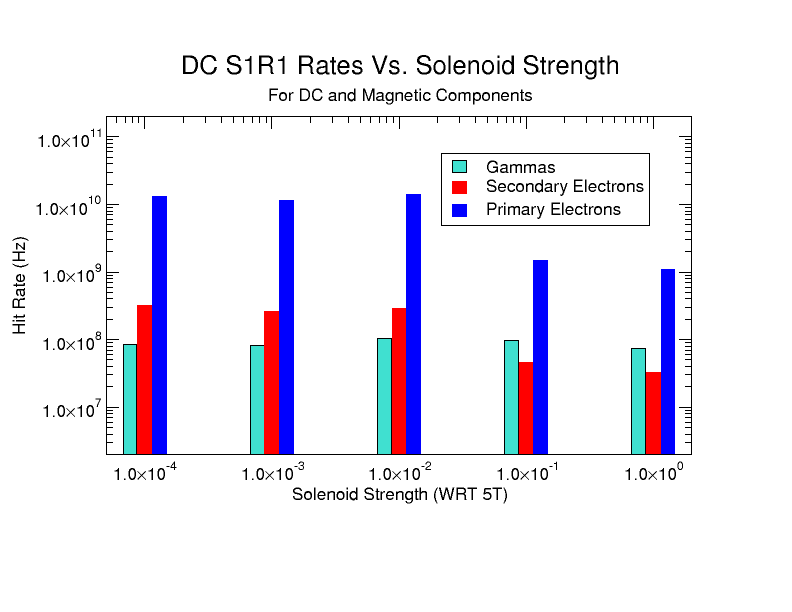
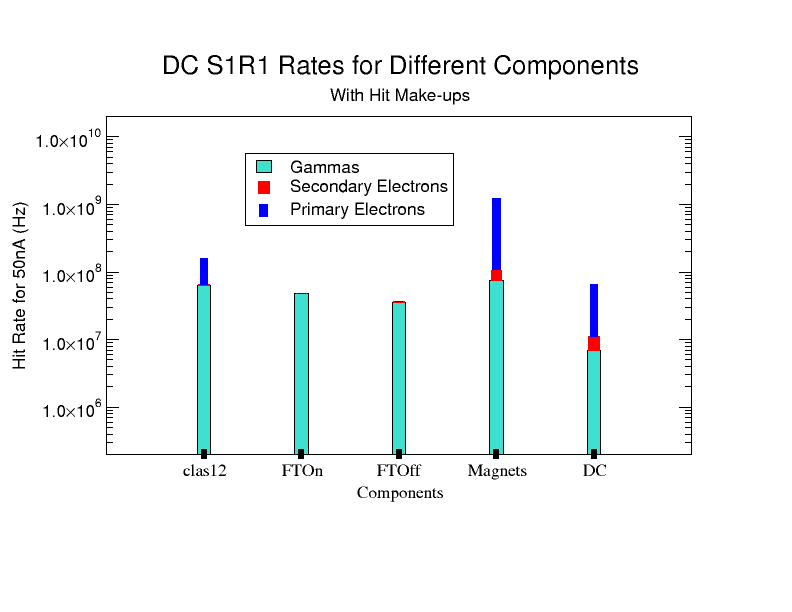
However, as the field reaches maximum, there are still particles which are found at higher values of that would have been expected to have remained after the effects of the Solenoid. To understand the causes of this phenomena, the hits on Region 1 can be broken into the most common types of particles that are detected; Primary Moller electrons and secondary electrons and photons caused by the Moller electron. Looking more closely at this particle makeup as the solenoid field is increased, we can see that the ratio of primary electrons to total hits decreases while the ratio of photons to total hits increases.
Without Magnet Components
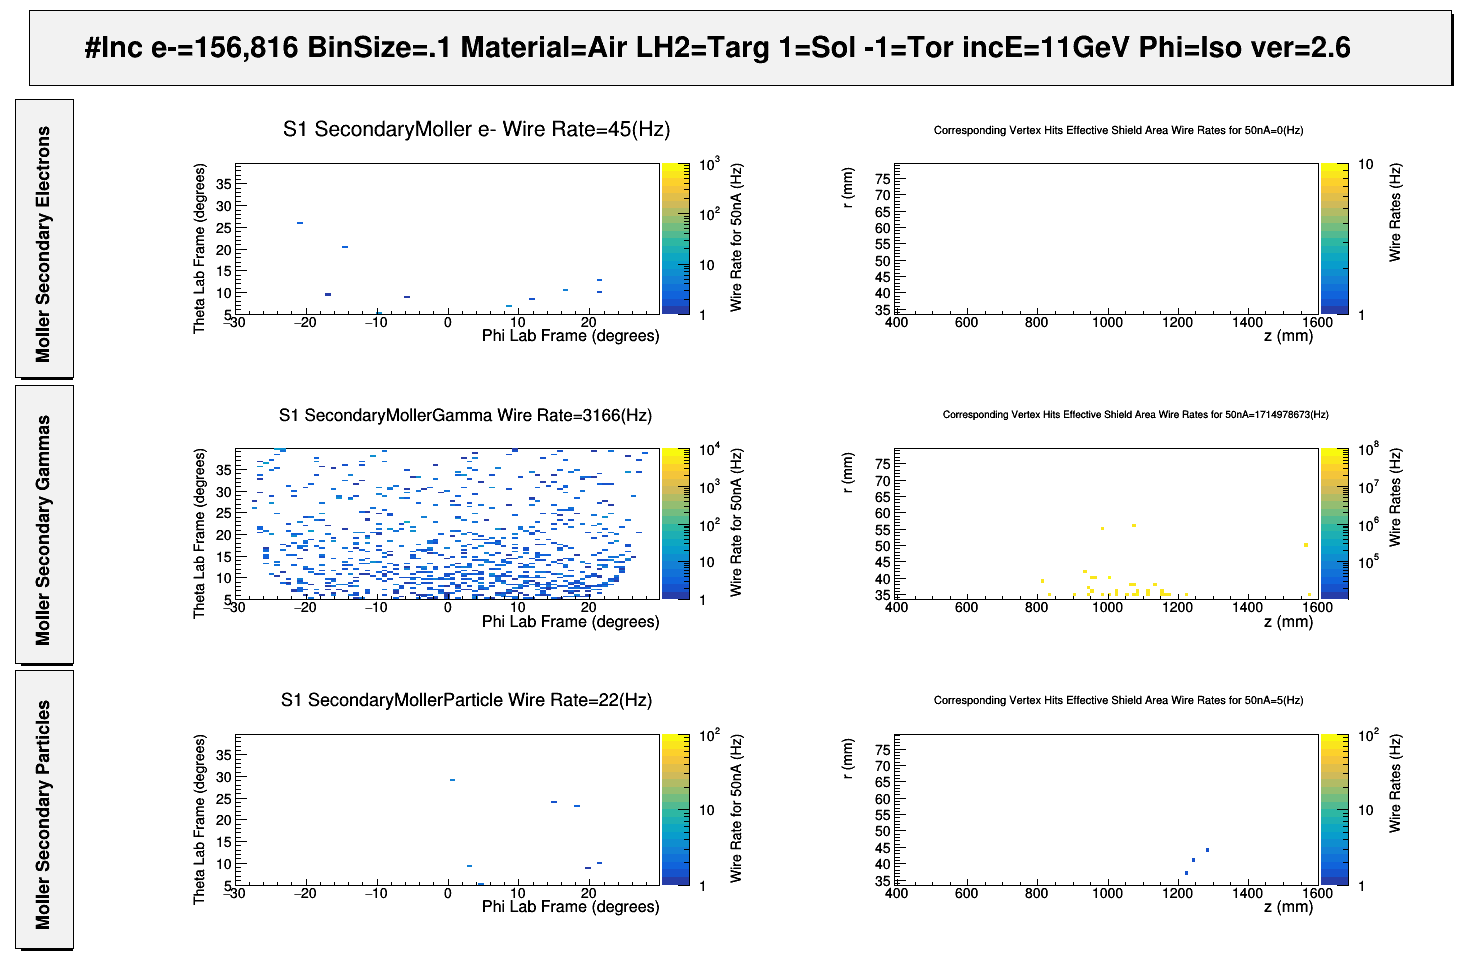
To examine the possibility that scattering is the cause of the noise, the simulation is further simplified by removing the magnetic components stored in the CAD directory.
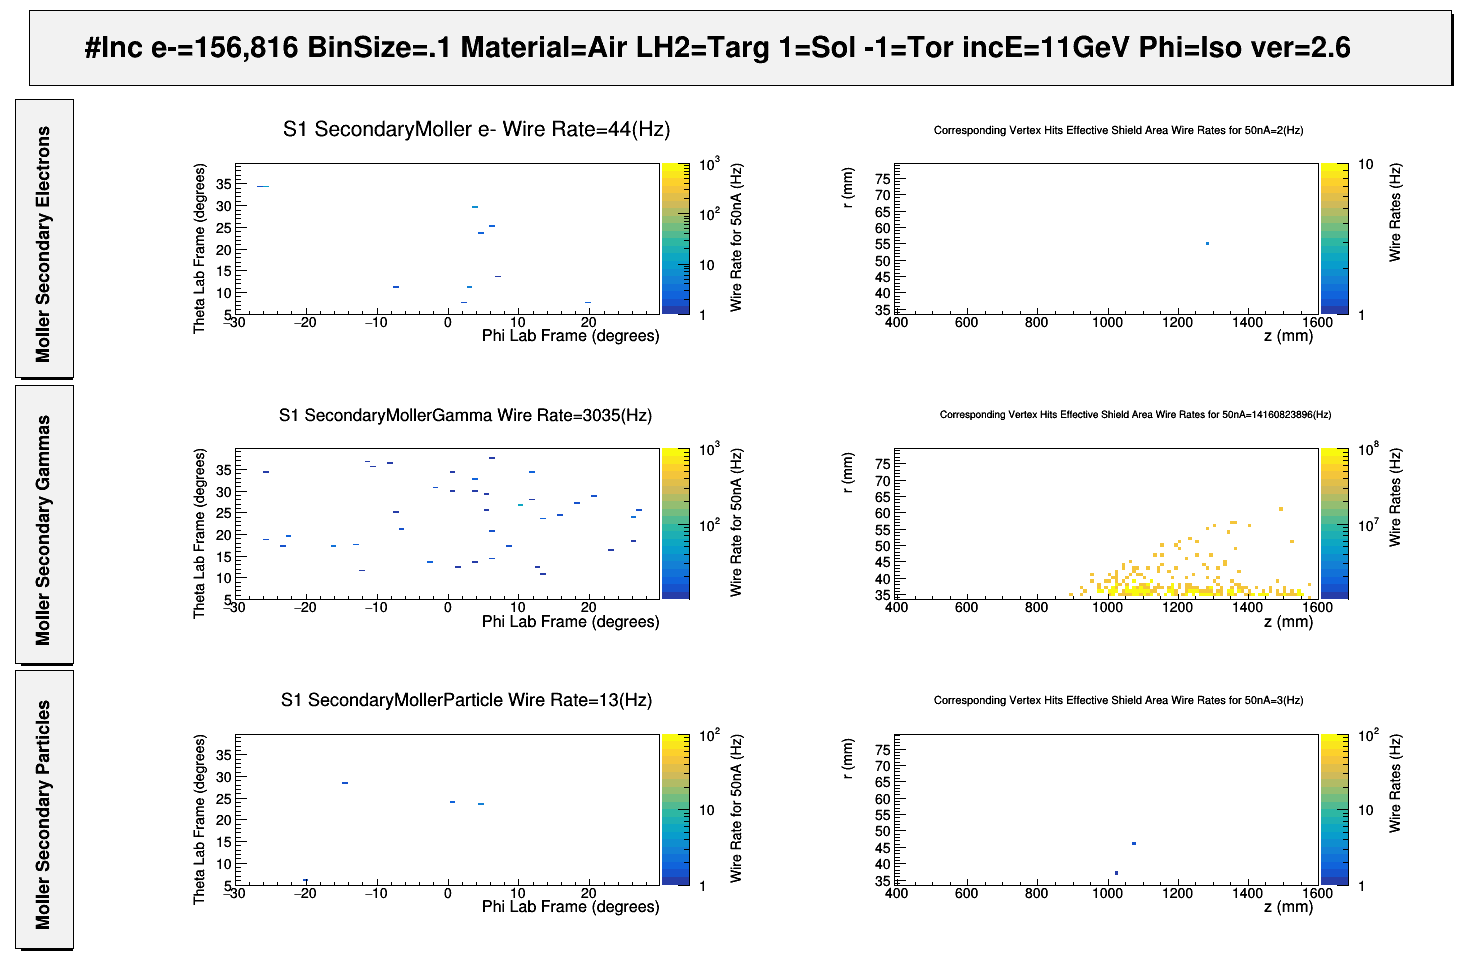
To effectively determine the cause of the remaining particles in S1R1 the hit particles' vertex points can be recorded producing a tomography plot. A changing field is still useful in that the lack of number of hits at high solenoid field strength would make determining the physical cause difficult.
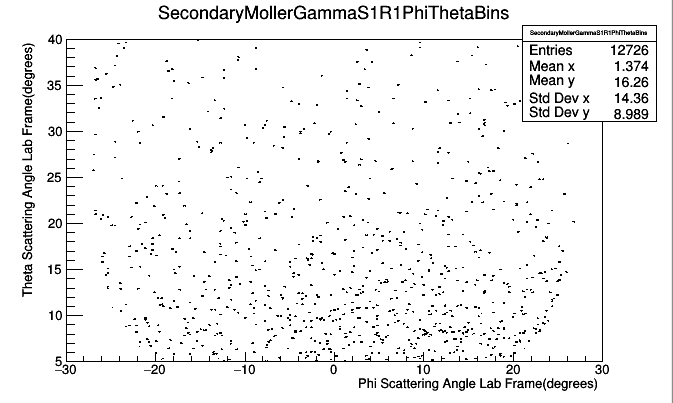
Photons Hits in R1
Secondary Electron Hits in R1
Primary Moller Electron Hits in R1
CLAS12 Conditions
Summarize with picture photo rates -vs- change and location of photons
Summarize secondary moller electron rate location
Determining and Verify Shield Limits
FTOn ShieldIn
For the Moller electron,
For the scattered electron, there are no secondary hits.
FTOff ShieldIn
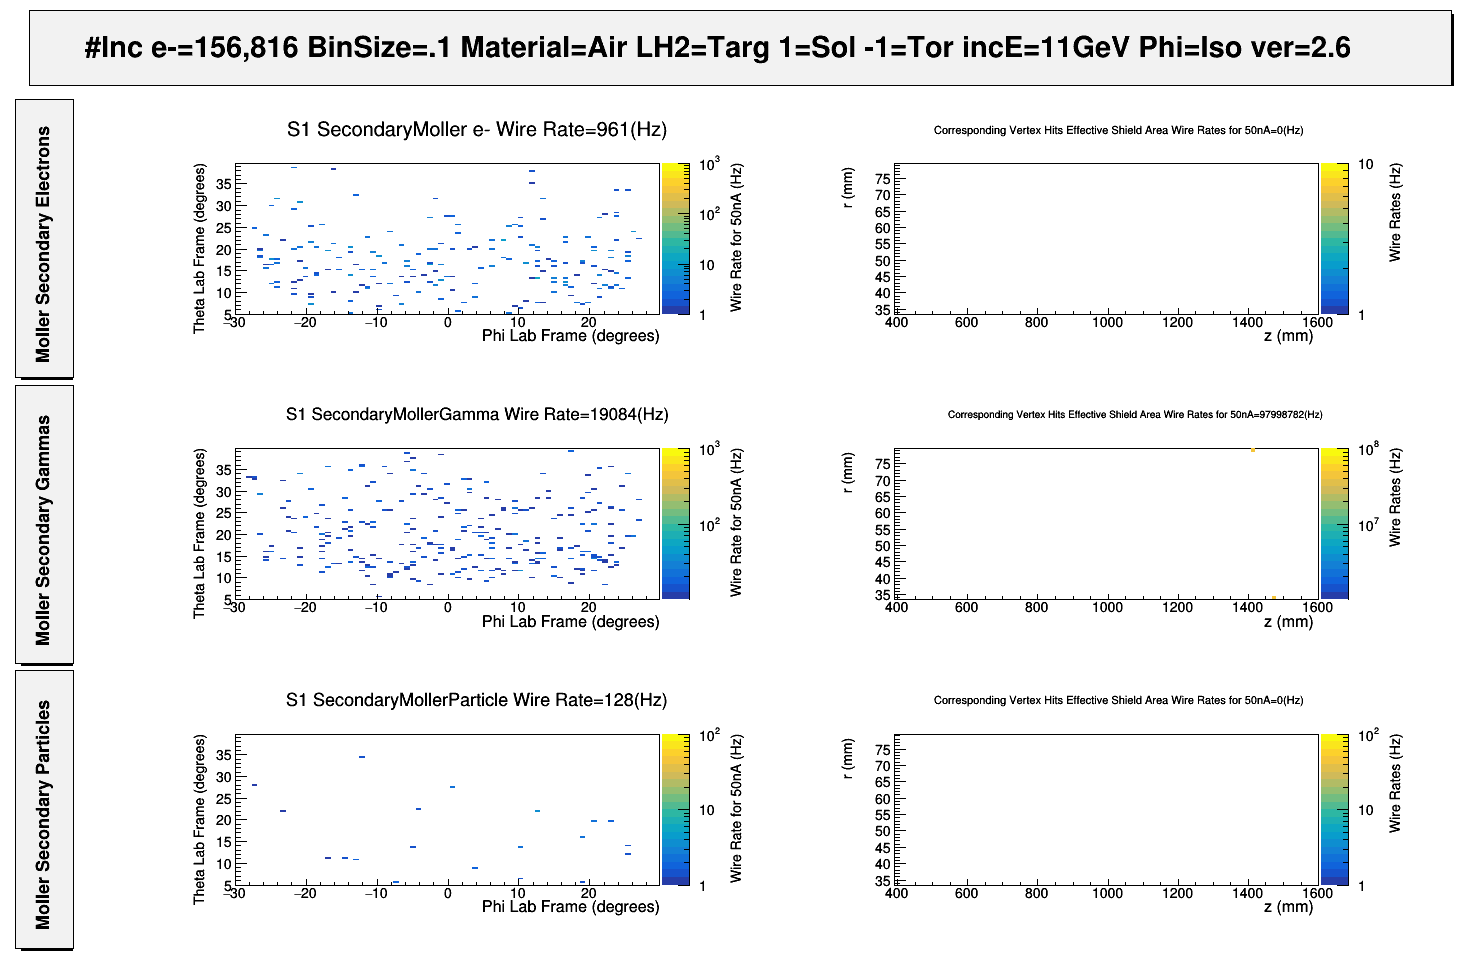
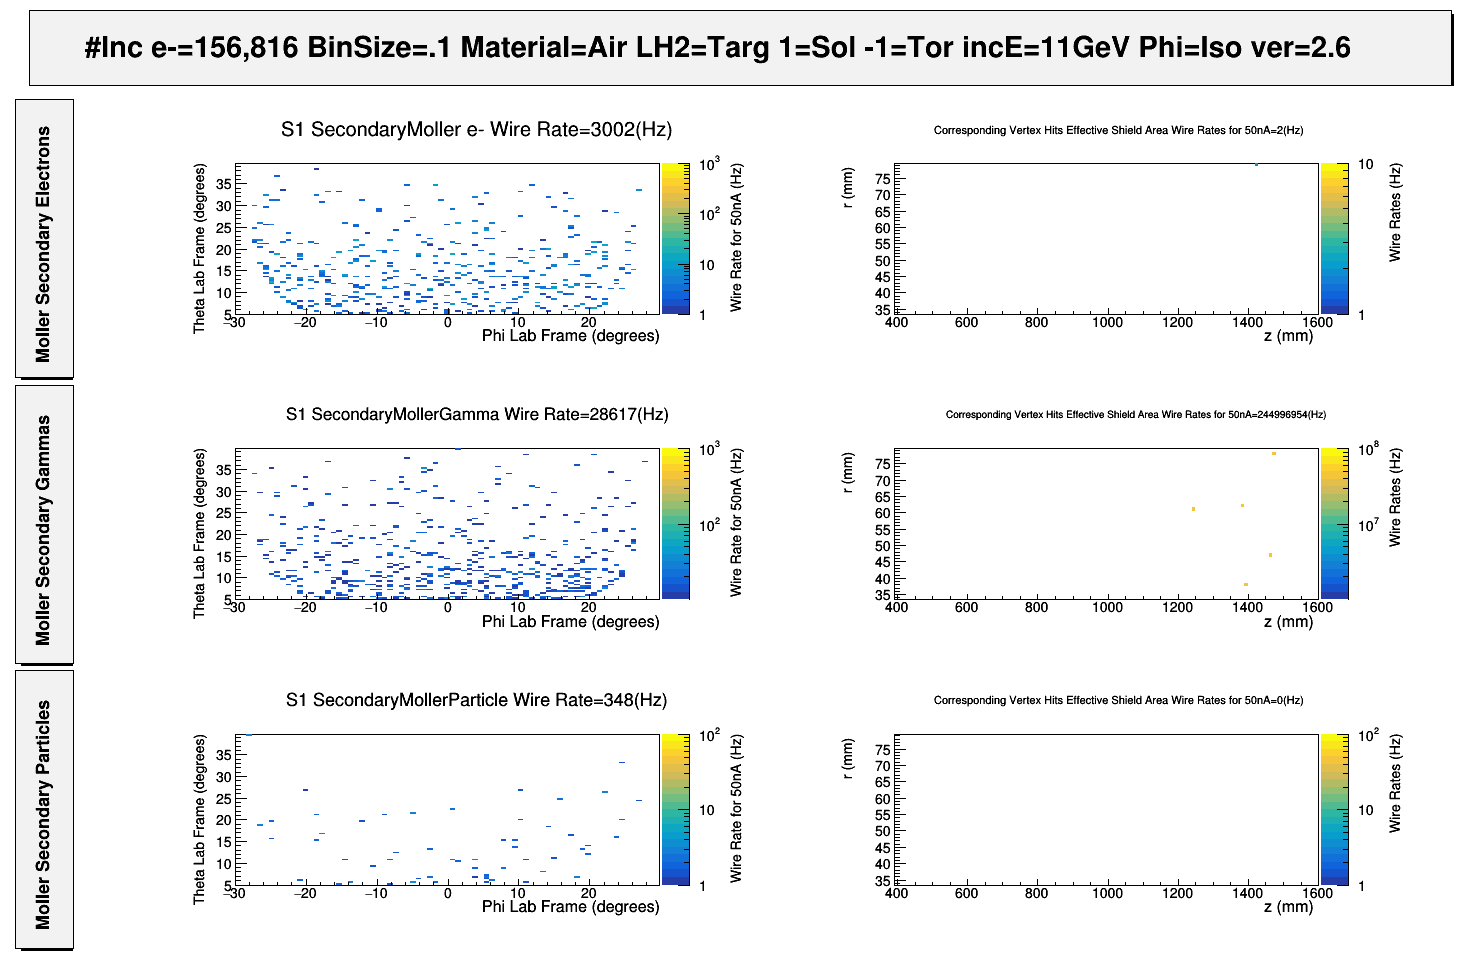
For secondary hits from the Moller electron
FTOn ShieldOut
FTOff ShieldOut
New Cone
FTOn
From beamline text file
1589.27-238.8=1350.47
PbCylinder | root | Pb pipe on beamline | 0*mm 0.0*mm 1350.47*mm | 0 0 0 | 999966 | Cons | 34*mm 36*mm 111.2*mm 113.2*mm 441.3*mm 0.0*deg 360*deg | beamline_w | no | 1 | 1 | 1 | 1 | 1 | no | no | no
At Standard Vertex Position:
High Cone Position:
Low Cone Position:
standard_R1_36_38_R2_111_113
At forward Vertex Position: (subtract 40mm from standard vertex distance)
High Cone Position:
Low Cone Position:
standard_R1_74_76_R2_151_153
Summary Tables
| 50nA | S1R1 2ndryMoller e- rate | S1R1 2ndryMoller gamma rate | S1R1 2ndryMoller particle rate | Effective Shield Rate |
|---|---|---|---|---|
| R1_36_38_R2_36_38 | 111 Hz | 10652 Hz | 37 Hz | ? |
| R1_36_38_R2_50_54 | 108 Hz | 10668 Hz | 31 Hz | ? |
| R1_36_38_R2_70_72 | 109 Hz | 11053 Hz | 45 Hz | ? |
| R1_36_38_R2_75_77 | Hz | Hz | Hz | ? |
| R1_36_38_R2_80_82 | Hz | Hz | Hz | ? |
| R1_36_38_R2_90_92 | Hz | Hz | Hz | ? |
| R1_36_38_R2_95_97 | Hz | Hz | Hz | ? |
| R1_36_38_R2_100_102 | Hz | Hz | Hz | ? |
| R1_36_38_R2_111_113 | Hz | Hz | Hz | ? |
| R1_36_38_R2_116_118 | Hz | Hz | Hz | ? |
| R1_36_38_R2_121_123 | Hz | Hz | Hz | ? |
| R1_74_76_R2_151_153 | Hz | Hz | Hz | ? |
| R1_36_38_R2_500_503 | 150 Hz | 12097 Hz | 46 Hz | ? |
| 50nA | S1R1 2ndryMoller e- rate | S1R1 2ndryMoller gamma rate | S1R1 2ndryMoller particle rate | Effective Shield Rate |
|---|---|---|---|---|
| R1_0_524.0_R2_0_1034.47 | ? | ? | ? | ? |
Moller Electrons below 5 degrees
CLAS12_MollerDataTable_12-16-2018
Moller events using an dual polarized target geometry with Raster
Photon Hits in R1 when Raster size has radius of 0.2 cm
Moller rate -vs- length of a single taerget
0.5 cm radius -vs- Z
Target is a one 0.5 cm radius cylinder of length Z.
By how much does the moller rate change at full field ?
Latest Stuff
VanWasshenova_Thesis#Mlr_Summ_TF
