Faraday Cup Analysis
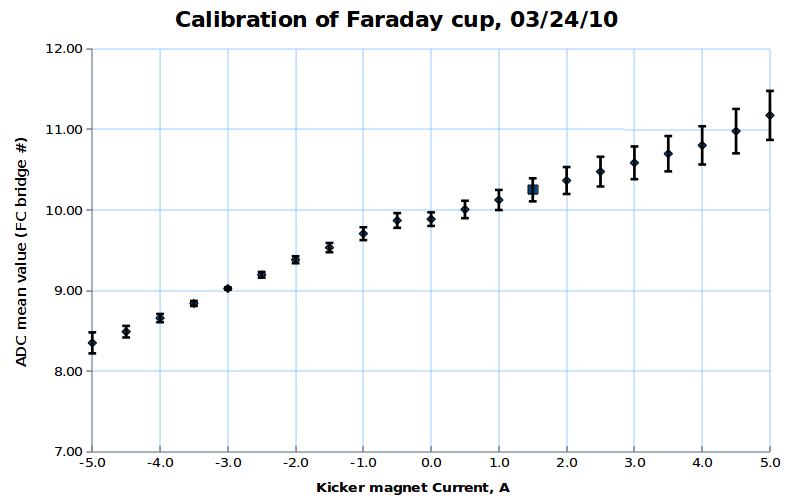
Kicker magnet calibration
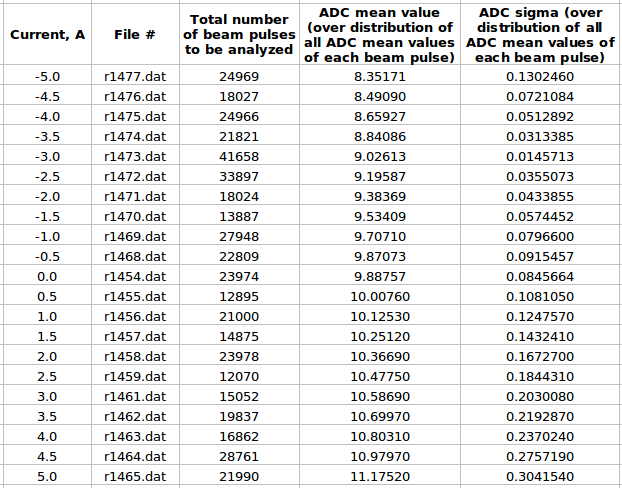
by using pulse by pulse ADC channel mean value distribution
For each beam pulse:
(average beam position for one pulse)
For distribution over all beam pulses:
(average beam position over all pulses)
(absolute error)
Here is:
1. ADC# = bridge#
2. Pulse# = ReadOut# = Entry# = Event#
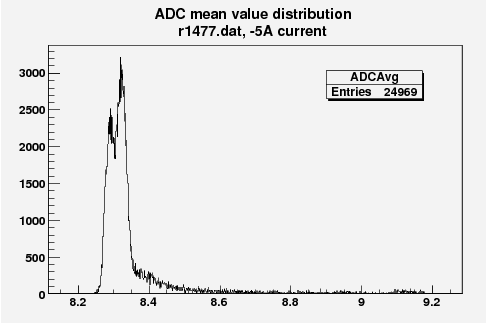
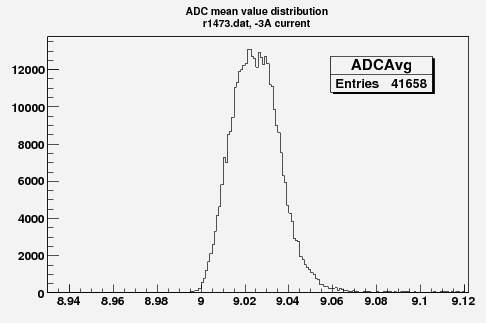
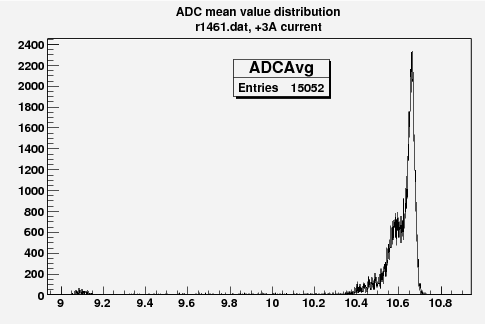
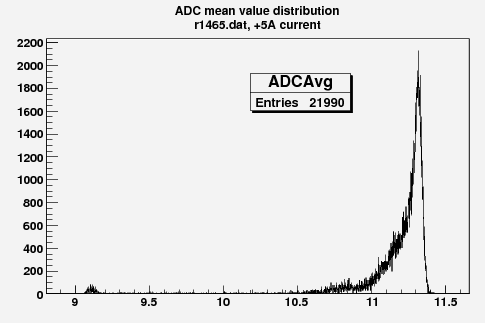
Some examples of ADC mean value distribution. Here are:
1. x axis: ADC mean value for one pulse
2. y axis: number of pulse w/ that ADC mean value
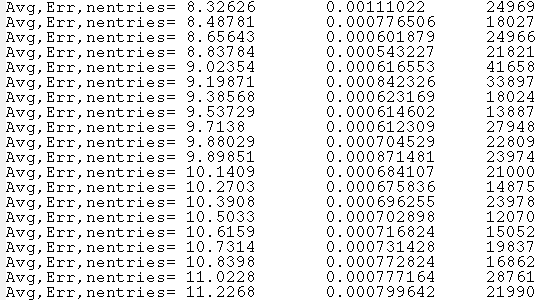
by using ADC channel charge distribution
For each ADC channel:
(total charge per one ADC channel)
(absolute error in charge distribution per one ADC channel assuming Poisson)
For each ADC channel we have (Q +- q)
For distribution over all ADC channel:
(average beam position over all pulses)
(absolute error)
For all ADC channel we have +-
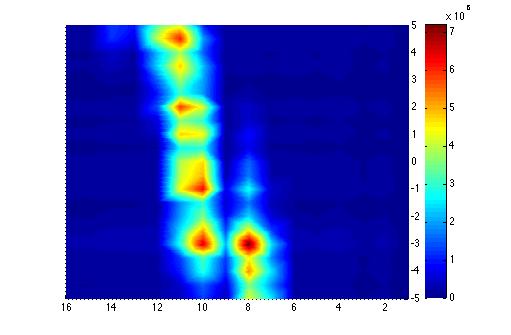
Faraday Cup 3D plot
Below is the plot of the charge in Faraday cup (pC) as a function of magnet current (vertical axis, A) (basically magnetic field) and ADC (horizontal axis).
What about moving beam?
"rain" plots
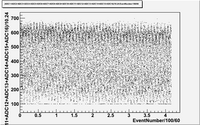
As we can see from plots above, the total charge for one block is strongly fluctuates with time.
Question: Is it moving beam or is it current fluctuation in beam pulse? Take in, for example 1477.dat(-5A)
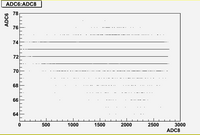
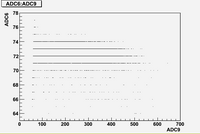
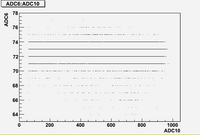
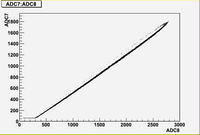
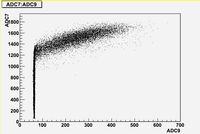
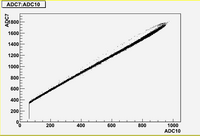
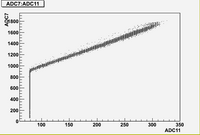
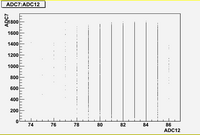
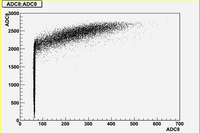
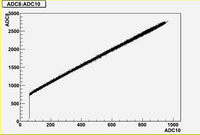
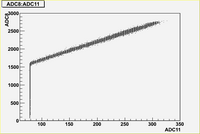
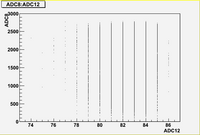
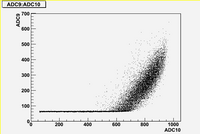
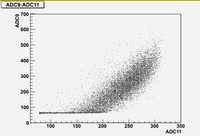
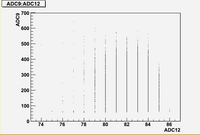
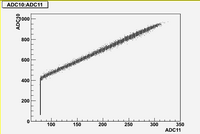
correlation plots
As we can see for case above above, there are strong correlations between blocks 7, 8, 9 and 11
Conclusion:
We have possibly moving up and down beam
Error Analysis
The ADC measures the charge deposited on each of the 16 Aluminum blocks. The ADC is a 12 bit ADC with a max input of 400 pc. THe means that the charge per channel is:
Run1477 -5A
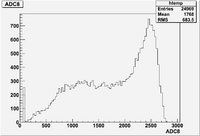
Raw ADC result for channel 8 :
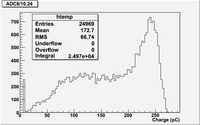
ADC 8 using channel -> Coul conversion:
The above histogram shows an RMS of 66.74 pC.
Comment
- The ADC basically counts the number of electrons collected by the aluminum FC bricks and transfered through the cables to the ADC. This is a poisson process with a large number of trials leading to a large mean value . One would expect a gaussian parent population with
The histogram shows
- Mean =
- RMS =
- What does this mean?
- The theoretical distribution would be Guassian with . The above suggests that the beam charge delivered to the FC is not following this statistical parent distribution. Most likely the beam current is changing while you are measuring the charge with the FC.
- Is the charge lost or is it just moving to different FC channels
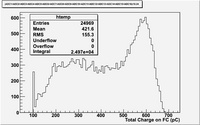
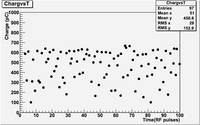
Within 100 RF pulses the total charge on the FC drops from 600 to 100 pC. It seems the beam current is very unstable.
There also appears to be a gaussian distribution centered around 600 pC and a wider one centered around 100 pC.
Could it be that I can put a cut on total beam current and see if the charge moves between FC elements?
Let see what the total charge looks like for 3 cases.
