TDC calibration
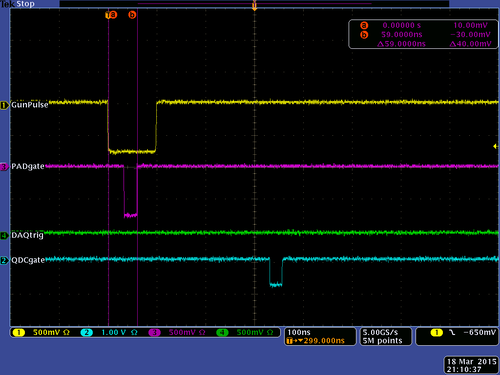
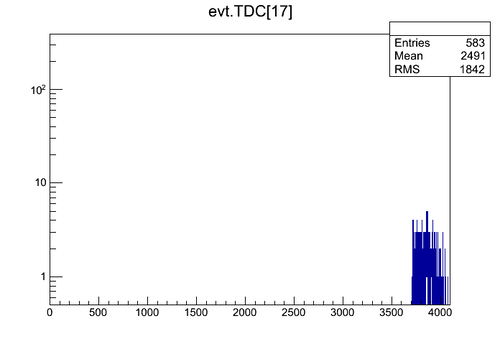
run# 8742: delay dt=59 ns between the fall side of the common start pulse and the rise side of the fake stop signal.
The data look like:
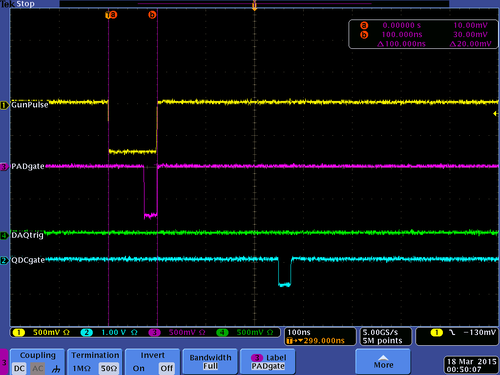
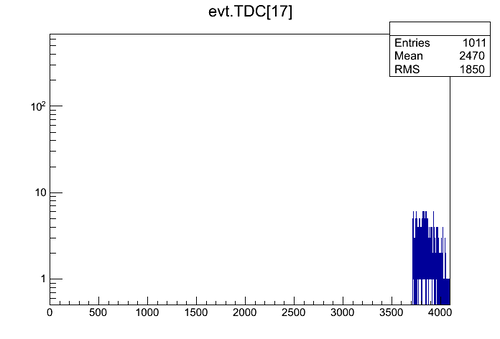
run# 8736: delay dt=100 ns between the fall side of the common start pulse and the rise side of the fake stop signal.
The data look like:
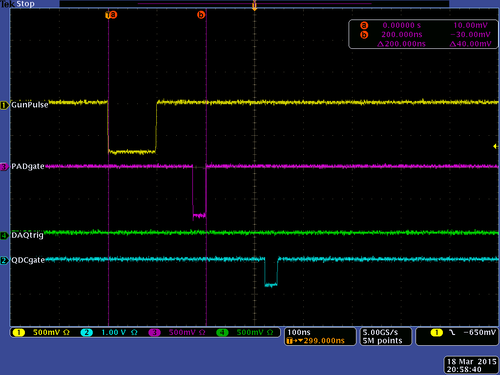
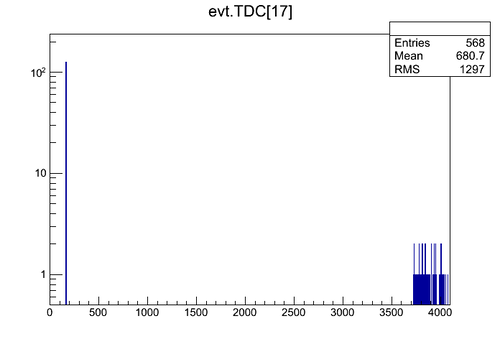
run# 8737: delay dt=200 ns between the fall side of the common start pulse and the rise side of the fake stop signal.
The data look like:
The mean of the peak is at 165.5 channel
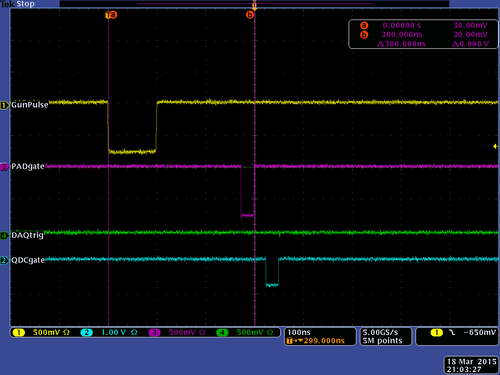
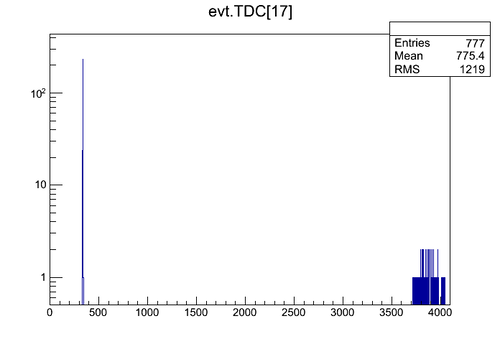
run# 8738: delay dt=300 ns between the fall side of the common start pulse and the rise side of the fake stop signal.
The data look like:
The mean of the peak is at 335.7 channel
run# 8739: delay dt=400 ns between the fall side of the common start pulse and the rise side of the fake stop signal.
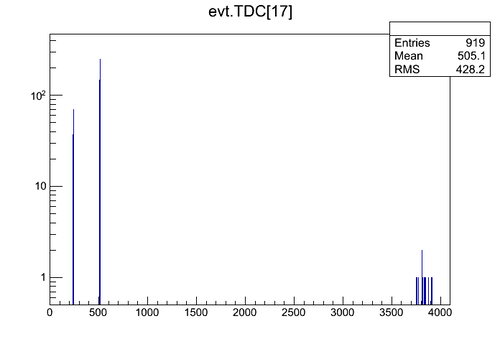
The data look like:
The mean of the peak is at 511.5 channel
run# 8740: delay dt=800 ns between the fall side of the common start pulse and the rise side of the fake stop signal.
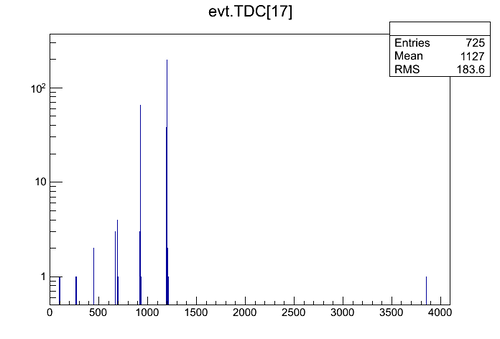
The mean of the peak is at 1197 channel
The data look like:
