BriansRanLogbook
Jump to navigation
Jump to search
This is where I write down what I'm doing
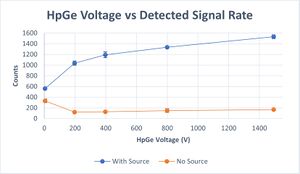
1/13/23 : Turned on HpGe HV to 1500 and learned about analog to digital signal processing
detected signal rate -vs- HpGe Voltage
HpGe Detector
| High Voltage (V) | Counts (with source) | Counts (no source) |
|---|---|---|
| 1492.67 | 1532.5 ± 36.67 | 167.5 ± 7.78 |
| 799.15 | 1336.5 ± 2.12 | 149.4 ± 34.65 |
| 396.83 | 1193.5 ± 54.48 | 127.5 ± 7.78 |
| 197.19 | 1035.5 ± 40.31 | 121 ± 4.24 |
| 4.88 | 562.5 ± 2.12 | 332 ± 35.36 |
He3 Tube
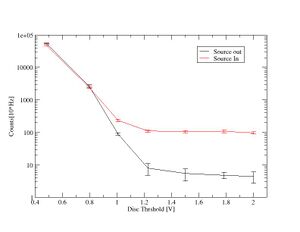
1/27/23 : Turned on He3 detector, adjusted to find counts with Cf source in containment and out of containment
2/3/23 : Same as 1/27, adjusting discriminator voltage and recording counts with Cf-252 source. Encountered strange effects of higher counts with source away at low QD voltage. Sets of measurements notably inconsistent.
| Discriminator Voltage (V) | Counts/10s (no source) | Counts/10s (with source) |
|---|---|---|
| 2.003 | 4.4 ± 1.67 | 97.0 ± 8.49 |
| 1.788 | 4.8 ± 1.09 | 108.2 ± 10.89 |
| 1.503 | 5.4 ± 2.22 | 105.7 ± 8.63 |
| 1.227 | 7.9 ± 3.14 | 109.8 ± 9.34 |
| 1.009 | 89.9 ± 7.87 | 234.1 ± 20.06 |
| 0.799 | 2656 ± 251.1 | 2447 ± 183.0 |
| 0.485 | 55479 ± 1325 | 48360 ± 1938 |
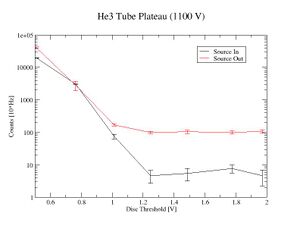
2/10/23 Same procedure as 2/3/23, just changing HV applied to He3 detector to values of 1300V then 1100V.
| Discriminator Voltage (V) | Counts/10s (no source) | Counts/10s (with source) |
|---|---|---|
| 1.971 | 4.6 ± 2.37 | 107.7 ± 13.17 |
| 1.775 | 7.7 ± 2.11 | 100 ± 10.70 |
| 1.486 | 5.5 ± 2.32 | 104.8 ± 12.79 |
| 1.248 | 4.7 ± 2.00 | 99.6 ± 7.09 |
| 1.013 | 75.2 ± 12.17 | 171 ± 12.82 |
| 0.762 | 3074 ± 143.0 | 2833 ± 894.7 |
| 0.509 | 19658 ± 424.6 | 40290 ± 2402 |
| Discriminator Voltage (V) | Counts/10s (no source) | Counts/10s (with source) |
|---|---|---|
| 1.971 | 5.4 ± 1.78 | 111.3 ± 9.97 |
| 1.773 | 5.3 ± 1.89 | 97.3 ± 7.70 |
| 1.524 | 7.1 ± 4.51 | 99.7 ± 11.78 |
| 1.275 | 12.2 ± 3.55 | 117.3 ± 23.11 |
| 0.993 | 177.7 ± 8.18 | 351.9 ± 28.71 |
| 0.784 | 2691.2 ± 114.7 | 2763.7 ± 126.2 |
| 0.485 | 50346 ± 3831 | 53920 ± 4354 |
03/31/2023
- Analyzed the plateau graphs.
- Began taking plateau measurements between a discriminator voltage range of about 1.000V and 1.250V to determine where the noise is cut from the signal.
- Got abnormal fluctuations in counts.
04/04/2023
- Worked with Dr. Forest to tune the He3 detector such that the peak height of the signal could be read by the computer.
- Set up the computer to read from the peak sensing ADC and start taking measurements.
- Started a background measurement to run overnight.
04/05/2023
- Ended the background measurement.
- Took a new measurement, this time with source out.
04/07/2023
- Worked with Dr. Forest to graph the two measurements and to create a graph of the source out measurement minus the background measurement.
- Began re-tuning the detector in order to repeat the process once more.
04/11/2023
- Finished tuning the detector and took another source out measurement. The discriminator threshold this time was at 3.660V.
- Completed a second background measurement.


