Difference between revisions of "20min run peak sensing histograms"
Jump to navigation
Jump to search
| Line 60: | Line 60: | ||
| 10/26||3.735 || 865 || Closed || off || 7932||0.5-1k Hz 3 min. | | 10/26||3.735 || 865 || Closed || off || 7932||0.5-1k Hz 3 min. | ||
|- | |- | ||
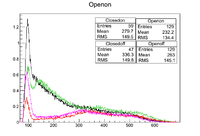
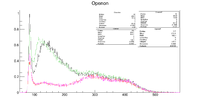
| − | |10/26|| 3.585 || || Open ||off || 7934 || 1k Hz 123" rate [[File:CATH3.370_GEM2. | + | |10/26|| 3.585 || || Open ||off || 7934 || 1k Hz 123" rate [[File:CATH3.370_GEM2.87_7935c_7934.png |100px ]] |
|- | |- | ||
| 10/26||3.585 || || Closed || off || 7935||0.5k Hz 118". | | 10/26||3.585 || || Closed || off || 7935||0.5k Hz 118". | ||
Revision as of 18:31, 26 October 2014
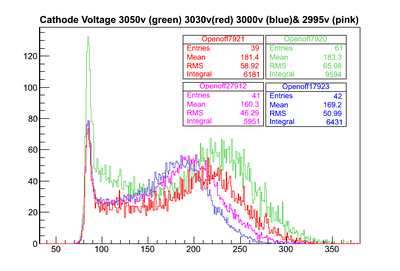
Cathode Voltage Effect on the Peak sensing Spectrum
All the measurements have the same GEM voltage 2.87 kV, just cathode voltage changes.
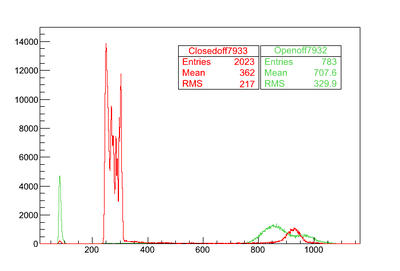
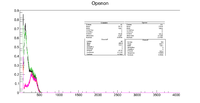
the figure below shows the the spectrum when the cathode at 3.735 kV (865V higher than the top GEM's voltage), which reaches to the maxmum rate that DAQ can measure.
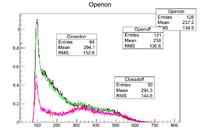
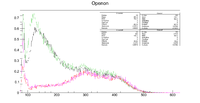
GEM-2.87 kV CATH-3.435 kV
Test runs
GO BACK [1]
