Difference between revisions of "201202 R1ProgressRep"
| Line 237: | Line 237: | ||
Tensions for the remaining SL2-Fields were measured for the suspected out of spec wires. An additional 83 wires were tested this morning. A summary of the findings follows: | Tensions for the remaining SL2-Fields were measured for the suspected out of spec wires. An additional 83 wires were tested this morning. A summary of the findings follows: | ||
| − | -Total wires tested 248 | + | |-Total wires tested 248 |
| − | + | |Bad Wires 31 | |
| − | + | |Wires with an increase in tension error 98 | |
| − | + | |Wires with a decrease in tension error 148 | |
It should be noted here that the majority of bad wires occur between column 91-228 where the acceptable error is +/- 10%. | It should be noted here that the majority of bad wires occur between column 91-228 where the acceptable error is +/- 10%. | ||
Revision as of 16:52, 22 February 2012
2/2/12
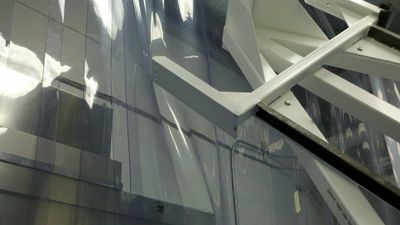
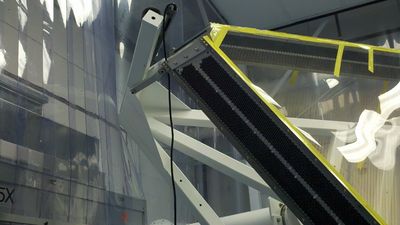
Chamber is being rotated this morning to start potting on the next endplate. All plugs and standoffs have been glued on this endplate.
There were clearance issues as we were trying to position the chamber to pot the other endplate.
The magnet rail needed to be removed so that we could position the chamber properly.
Also, we are limited to how much we can rotate the chamber.
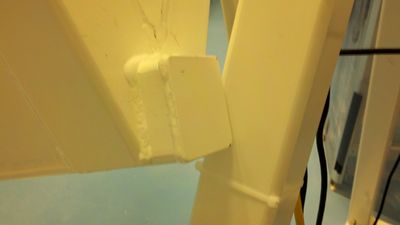 Camera settings give this image a yellow hue...sorry :P
Because of this clearance issue, we couldn't even rotate the chamber 270°, but I don't even know if we will ever need to rotate the chamber this much.
We got around this by shifting the entire chamber/strongback/upper shaft forward several inches.
2/6/12
Potting has been completed.
Mylar window installation will begin tomorrow.
2/9/12
After some discussions it was decided that we need to re-measure the wire tensions and re-check wire integrity to confirm the chamber is ready for Mylar window installation.
The magnet will be re-installed.
Tested wire integrity on first 30 wires SL2
2/14/12
- Power supply current for magnet set to 50Amps DC
- Removed Drift Chamber
- re-positioned the rotating shaft to its original position
- Installed bolt 18 to prevent shaft from moving horizontally.
- Reinstalled magnet rail with drift chamber lying horizontally on the floor
- installed chamber back onto the A-frame
- reinstalled magnet
- hooked up power supply leads to begin tension measurements
Hampton Roads Article on ODUs R2 construction
http://hamptonroads.com/2012/02/device-built-odu-crack-natures-code-takes-ride
2/15/12
2/16/12
Tension calculation
Superlayer 2
Column 190 Row 7
- SL2-S1-Field (not trend file) Wire length = 151.76
- Trend File wire length = 145.44 (Spreadsheet indicates out of spec)
After further examination, we find that the wire lengths are correct. We were mistakenly comparing a SL1 wire length to a SL2 wire length. (2/17/12)
2/17/12
The following calculations were made using tension measurement data collected after wire stringing. An estimate of a 7% decrease over the entire chamber in tension errors was used to identify potential out of spec wires. The 'Total Wires out of Spec (7%)' is an over estimation. Further analysis will determine a more accurate percent decrease in tension to provide a more conservative count of potential out of spec wires.
Tension Measurement Summary
| SL1-Field Wires | |||||
| Tension Error Calculations | Number of Wires | ||||
| Column 2-45 (<-0.20) | 9 | ||||
| Column 46-90 (<-0.15) | 9 | ||||
| Column 91-227 (<-0.10)(7%) | 348 | ||||
| Column 91-227 (<-0.10)(3%) | 59 | ||||
| Column 2-227 (>0.15) | 0 | ||||
| Total Wires out of Spec (7%) | 366 | ||||
| Total Wires out of Spec (3% at 91-227) | 77 | ||||
| % Wires out of Spec (7%) | 23.2% | ||||
| % Wires out of Spec (3%) | 4.89% | ||||
| SL1-Sense Wires | |||||
| Tension Error Calculations | Number of Wires | ||||
| Column 3-75 (<-0.20) | 8 | ||||
| Column 76-150 (<-0.15) | 3 | ||||
| Column 151-227 (<-0.10)(7%) | 46 | ||||
| Column 151-227 (<-0.10)(3%) | 6 | ||||
| Column 2-227 (>0.15) | 0 | ||||
| Total Wires out of Spec (7%) | 57 | ||||
| Total Wires out of Spec (3% at 151-227) | 17 | ||||
| % Wires out of Spec (7%) | 8.49% | ||||
| % Wires out of Spec (3%) | 2.53% | ||||
| SL2-Field Wires | |||||
| Tension Error Calculations | Number of Wires | ||||
| Column 2-45 (<-0.20) | 5 | ||||
| Column 46-90 (<-0.15) | 13 | ||||
| Column 91-227 (<-0.10)(7%) | 231 | ||||
| Column 91-227 (<-0.10)(3%) | 70 | ||||
| Column 2-227 (>0.15) | 0 | ||||
| Total Wires out of Spec (7%) | 249 | ||||
| Total Wires out of Spec (3% at 91-227) | 88 | ||||
| % Wires out of Spec (7%) | 15.8% | ||||
| % Wires out of Spec (3%) | 5.59% | ||||
| SL2-Sense Wires | |||||
| Tension Error Calculations | Number of Wires | ||||
| Column 3-75 (<-0.20) | 6 | ||||
| Column 76-150 (<-0.15) | 11 | ||||
| Column 151-227 (<-0.10)(7%) | 30 | ||||
| Column 151-227 (<-0.10)(3%) | 7 | ||||
| Column 2-227 (>0.15) | 0 | ||||
| Total Wires out of Spec (7%) | 47 | ||||
| Total Wires out of Spec (3% at 151-227) | 24 | ||||
| % Wires out of Spec (7%) | 7.00% | ||||
| % Wires out of Spec (3%) | 3.58% | ||||
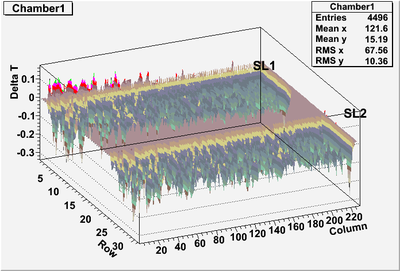
Chamber 1 Tension difference
- Measured Tension differences based on Tension measured on the same day that the wire was strung
- Tension differences assuming a 7 % decrease occurs after all wires have been strung.
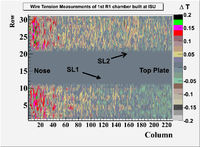
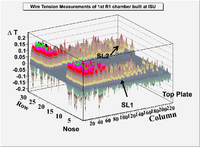
To construct the graph below it was assumed that the tension measurements have decrease by 7% since they were measured.
SL1 lies between rows 1 and 10.
SL2 lies between row 20 and 30.
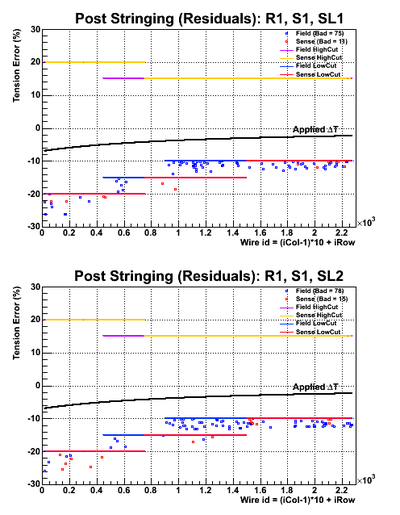
Dustin made the plot below to illustrate just how many wires are beyond the specifications if we assume a Tension shift given by the black line. Without this assumption, only two wires are outside of specs. The black line labeled "applied T, represents an extrapolation of measured Tension decreases from the "Trend" data.
2/21/12
Tensions for SL2-Fields were measured for the suspected out of spec wires. Out of 165 wires tested today, 65 showed a decrease in tension error and 98 showed an increase in tension error with respect to the original test error. A decrease in error corresponds to a decrease in tension, indicating loosening of wires since the last testing. An increase in error indicates the converse. Further tension testing will be done tomorrow to gather additional data.
2/22/12
Tensions for the remaining SL2-Fields were measured for the suspected out of spec wires. An additional 83 wires were tested this morning. A summary of the findings follows:
|-Total wires tested 248 |Bad Wires 31 |Wires with an increase in tension error 98 |Wires with a decrease in tension error 148
It should be noted here that the majority of bad wires occur between column 91-228 where the acceptable error is +/- 10%. There were no wires found with a positive error beyond the acceptable limits. -Wires in Column 2-45 (Error <-0.20) 1 -Wires in Column 46-90 (Error <-0.15) 0 -Wires in Column 91-228 (Error <-0.10) 30
-In Column 91-228: -Min Tension Error -0.39 -Max Tension Error 0.13 -Average Tension Error 0.01 -Average of Tension Errors <-0.10 -0.14
