Difference between revisions of "BriansRanLogbook"
Jump to navigation
Jump to search
| Line 124: | Line 124: | ||
* Finished tuning the detector and took another source out measurement. The discriminator threshold this time was at 3.660V. | * Finished tuning the detector and took another source out measurement. The discriminator threshold this time was at 3.660V. | ||
* Completed a second background measurement. | * Completed a second background measurement. | ||
| + | |||
| + | =04/12/2023= | ||
| + | * Started a new plateau measurement by taking a measurement with the source out and viewing the graph in root. | ||
| + | * Since the He3 detector was readjusted the new point where noise is cut from the signal has shifted, after some measurements it was determined to now be somewhere between 1.900 and 2.000 instead of the window from 03/31/2023. | ||
| + | * Took a source out measurement at a discriminator threshold 1.900V. | ||
| + | |||
| + | =04/18/2023= | ||
| + | * Before starting measurements the GUI displayed an error "Lost Connection to the Platform." Had to restart the process. | ||
| + | * After adjusting the discriminator threshold to 1.927V and taking a source out measurement, the data file produced no results when graphing the data in ROOT. Was unable to determine the reason for this. It's possible the width of the logic pulse was accidentally adjusted while while changing the disc voltage or that some adjustment was made to their position so that the computer does not have enough time to read out the measurement. Will check the detector is correctly adjusted and ask Dr. Forest when he returns if that is not the problem. | ||
Revision as of 22:43, 18 April 2023
This is where I write down what I'm doing
1/13/23 : Turned on HpGe HV to 1500 and learned about analog to digital signal processing
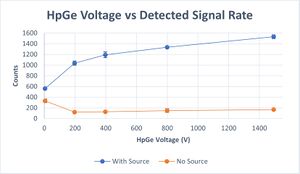
detected signal rate -vs- HpGe Voltage
HpGe Detector
| High Voltage (V) | Counts (with source) | Counts (no source) |
|---|---|---|
| 1492.67 | 1532.5 ± 36.67 | 167.5 ± 7.78 |
| 799.15 | 1336.5 ± 2.12 | 149.4 ± 34.65 |
| 396.83 | 1193.5 ± 54.48 | 127.5 ± 7.78 |
| 197.19 | 1035.5 ± 40.31 | 121 ± 4.24 |
| 4.88 | 562.5 ± 2.12 | 332 ± 35.36 |
He3 Tube
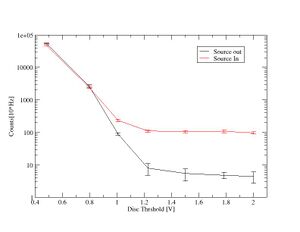
1/27/23 : Turned on He3 detector, adjusted to find counts with Cf source in containment and out of containment
2/3/23 : Same as 1/27, adjusting discriminator voltage and recording counts with Cf-252 source. Encountered strange effects of higher counts with source away at low QD voltage. Sets of measurements notably inconsistent.
| Discriminator Voltage (V) | Counts/10s (no source) | Counts/10s (with source) |
|---|---|---|
| 2.003 | 4.4 ± 1.67 | 97.0 ± 8.49 |
| 1.788 | 4.8 ± 1.09 | 108.2 ± 10.89 |
| 1.503 | 5.4 ± 2.22 | 105.7 ± 8.63 |
| 1.227 | 7.9 ± 3.14 | 109.8 ± 9.34 |
| 1.009 | 89.9 ± 7.87 | 234.1 ± 20.06 |
| 0.799 | 2656 ± 251.1 | 2447 ± 183.0 |
| 0.485 | 55479 ± 1325 | 48360 ± 1938 |
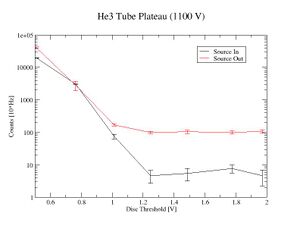
2/10/23 Same procedure as 2/3/23, just changing HV applied to He3 detector to values of 1300V then 1100V.
| Discriminator Voltage (V) | Counts/10s (no source) | Counts/10s (with source) |
|---|---|---|
| 1.971 | 4.6 ± 2.37 | 107.7 ± 13.17 |
| 1.775 | 7.7 ± 2.11 | 100 ± 10.70 |
| 1.486 | 5.5 ± 2.32 | 104.8 ± 12.79 |
| 1.248 | 4.7 ± 2.00 | 99.6 ± 7.09 |
| 1.013 | 75.2 ± 12.17 | 171 ± 12.82 |
| 0.762 | 3074 ± 143.0 | 2833 ± 894.7 |
| 0.509 | 19658 ± 424.6 | 40290 ± 2402 |
| Discriminator Voltage (V) | Counts/10s (no source) | Counts/10s (with source) |
|---|---|---|
| 1.971 | 5.4 ± 1.78 | 111.3 ± 9.97 |
| 1.773 | 5.3 ± 1.89 | 97.3 ± 7.70 |
| 1.524 | 7.1 ± 4.51 | 99.7 ± 11.78 |
| 1.275 | 12.2 ± 3.55 | 117.3 ± 23.11 |
| 0.993 | 177.7 ± 8.18 | 351.9 ± 28.71 |
| 0.784 | 2691.2 ± 114.7 | 2763.7 ± 126.2 |
| 0.485 | 50346 ± 3831 | 53920 ± 4354 |
03/31/2023
- Analyzed the plateau graphs.
- Began taking plateau measurements between a discriminator voltage range of about 1.000V and 1.250V to determine where the noise is cut from the signal.
- Got abnormal fluctuations in counts.
04/04/2023
- Worked with Dr. Forest to tune the He3 detector such that the peak height of the signal could be read by the computer.
- Set up the computer to read from the peak sensing ADC and start taking measurements.
- Started a background measurement to run overnight.
04/05/2023
- Ended the background measurement.
- Took a new measurement, this time with source out.
04/07/2023
- Worked with Dr. Forest to graph the two measurements and to create a graph of the source out measurement minus the background measurement.
- Began re-tuning the detector in order to repeat the process once more.
04/11/2023
- Finished tuning the detector and took another source out measurement. The discriminator threshold this time was at 3.660V.
- Completed a second background measurement.
04/12/2023
- Started a new plateau measurement by taking a measurement with the source out and viewing the graph in root.
- Since the He3 detector was readjusted the new point where noise is cut from the signal has shifted, after some measurements it was determined to now be somewhere between 1.900 and 2.000 instead of the window from 03/31/2023.
- Took a source out measurement at a discriminator threshold 1.900V.
04/18/2023
- Before starting measurements the GUI displayed an error "Lost Connection to the Platform." Had to restart the process.
- After adjusting the discriminator threshold to 1.927V and taking a source out measurement, the data file produced no results when graphing the data in ROOT. Was unable to determine the reason for this. It's possible the width of the logic pulse was accidentally adjusted while while changing the disc voltage or that some adjustment was made to their position so that the computer does not have enough time to read out the measurement. Will check the detector is correctly adjusted and ask Dr. Forest when he returns if that is not the problem.


