Difference between revisions of "G4Beamline PbBi"
| Line 76: | Line 76: | ||
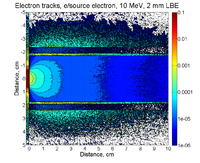
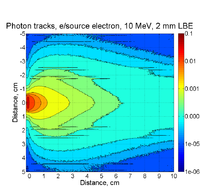
[[File:ElectronTracks.png| 200 px]][[File:PhotonTracks.png| 200 px]] | [[File:ElectronTracks.png| 200 px]][[File:PhotonTracks.png| 200 px]] | ||
| + | |||
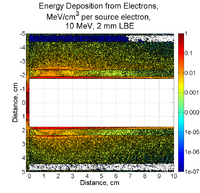
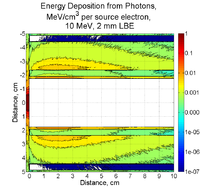
| + | [[File:ElectronEnergy.png| 200 px]][[File:PhotonEnergy.png| 200 px]] | ||
| + | |||
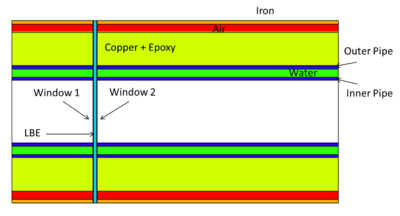
| + | MCNPX simulations of energy deposition into different cells are below. There is a slight overestimate (they add up to about 120%). Positrons contribute less than 1% of electrons' contribution. No magnetic filed is assumed. | ||
| + | |||
| + | [[File:Model.png| 400 px]] | ||
| + | |||
| + | [[File:Table1.png| 200 px]][[File:PTable2.png| 200 px]] | ||
[[File:ElectronEnergy.png| 200 px]][[File:PhotonEnergy.png| 200 px]] | [[File:ElectronEnergy.png| 200 px]][[File:PhotonEnergy.png| 200 px]] | ||
Revision as of 20:13, 11 May 2015
Development of a Positron source using a PbBi converter and a Solenoid
Converter target properties
Definition of Lead Bismuth
1cm diameter target
2 mm thick PbBi
0.5 Tesla solenoid
Desire to know
Emmittance (mrad * mm)
dispersion (Delta P/P) (mradian/1000th mm/1000th)
of electrons after the PbBi target.
pole face rotation in vertical plane.
G4BeamLine and MCNPX
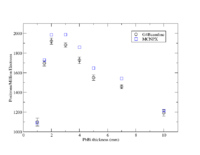
Target thickness optimization
PbBi_THickness_GaussBeam
2mm thick PbBi, 10 MeV, 1 cm cylindrical incident electron distribution
G4beamline pencil beam 10 cm radius
beam ellipse particle=e- nEvents=1000000 beamZ=0.0 beamX=0. beamY=0. \
        sigmaX=10.0 sigmaY=10.0 sigmaXp=0.000 sigmaYp=0.000 \
      meanMomentum=10. sigmaE=0. maxR=10.
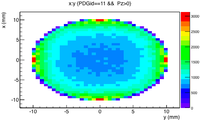
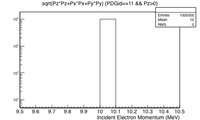
Incident Electron spatial distribution and energy
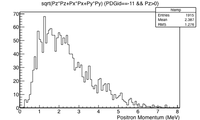
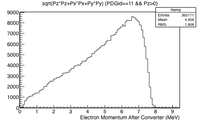
Positron and Electron Momentum after the converter
| PbBi Thickness (mm) | #positrons/million electrons (G4Beamline) | #positrons/million electrons (MCNPX) |
| 1 | 1169,1083,1068,1090,1088 =1100 40 | 1091 |
| 1.5 | 1723, 1668,1671, 1687,1726=1695 28 | 1728 |
| 2 | 1902,1921,1886,1967,1922=1920 30 | 1984 |
| 3 | 1920,1880,1883,1864,1857=1881 24 | 1986 |
| 4 | 1688, 1766, 1712, 1709, 1753=1726 33 | 1858 |
| 5 | 1569,1585,1509 ,1536,1551=1550 29 | 1646 |
| 7 | 1475,1450,1457,1428,1477 =1457 20 | 1541 |
| 10 | 1250,1180,1178,1186,1166=1192 33 | 1216 |
MCNPX simulations of energy deposition into different cells are below. There is a slight overestimate (they add up to about 120%). Positrons contribute less than 1% of electrons' contribution. No magnetic filed is assumed.
2mm thick PbBi, 10 MeV, point source
G4beamline pencil beam 10 cm radius
beam ellipse particle=e- nEvents=1000000 beamZ=0.0 beamX=0. beamY=0. \
        sigmaX=10.0 sigmaY=10.0 sigmaXp=0.000 sigmaYp=0.000 \
      meanMomentum=10. sigmaE=0. maxR=10.
| PbBi Thickness (mm) | #positrons/million electrons (G4Beamline) | #positrons/million electrons (MCNPX) |
| 1 | 1091 | |
| 1.5 | 1728 | |
| 2 | 1902 43 | 1984 |
| 2.5 | 2062 | |
| 3 | 13 | 1986 |
| 3.5 | 1938 | |
| 4 | 39 | 1858 |
| 5 | 1646 | |
| 6 | 37 | 1541 |
| 10 | 1216 |
Solenoid
Inner Radiusu=
Outer Radius =
Length =
Current=
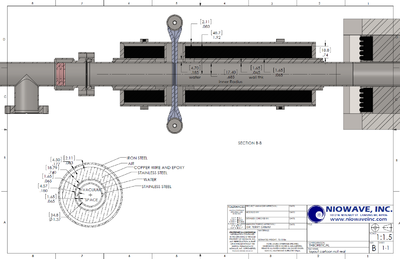
Magnetic Field Map in cylindrical coordinates (Z & R) from Niowave
