Difference between revisions of "July2012PosSimulation"
| Line 137: | Line 137: | ||
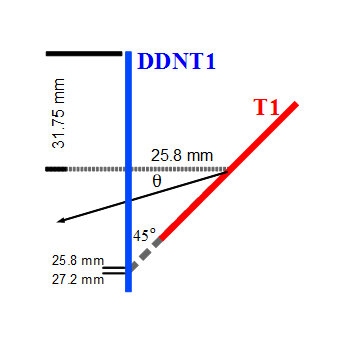
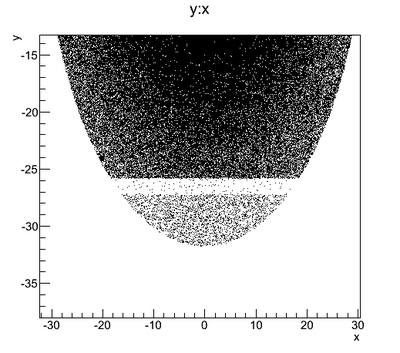
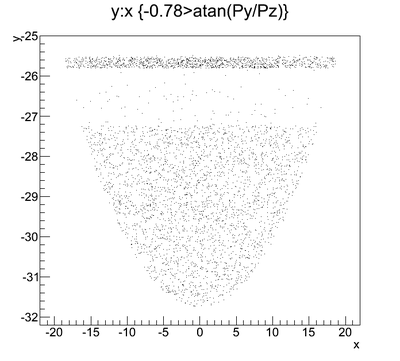
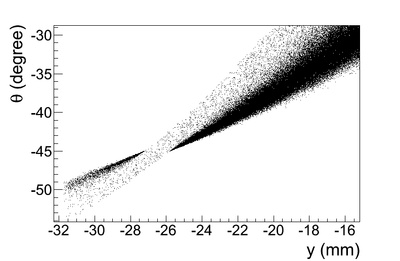
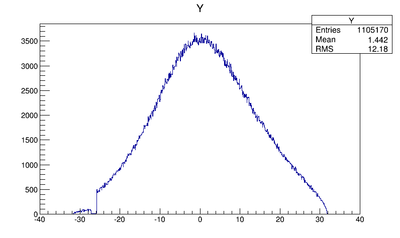
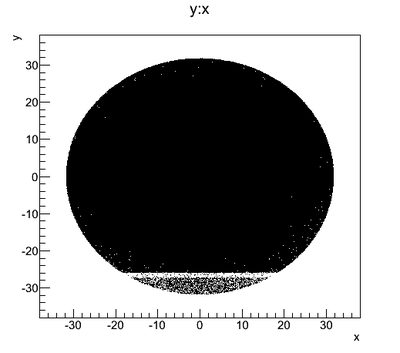
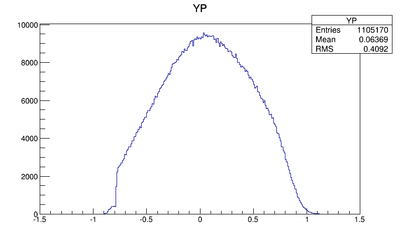
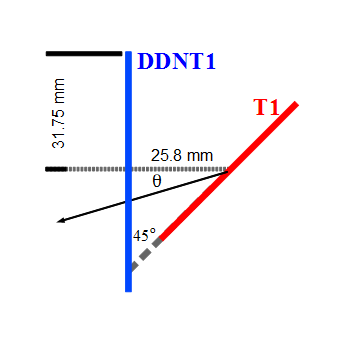
The Y-position distribution of the beam shown in Figure XXXX has a sharp drop in the region between -25.8 mm and -27.2 mm that corresponds to the boundary of the target T1. Figure YYY shows the geometry of the target T1 and the sensitive detector DDNT1. If the target size was increased, it would eventually intersected the detector DDNT1 at a distance of 25.8 mm from the beam center. A 1.4 mm wide stripe of low counts is visible on DDNT1 that is a result of the target's thickness of 1.016 mm and the 45 degree angle of intersection. (<math>1.016 \sqrt{2}=1.44</math>). The edge of the target does not produce many positrons compared to the face of the target, and as a result you see the stripe. | The Y-position distribution of the beam shown in Figure XXXX has a sharp drop in the region between -25.8 mm and -27.2 mm that corresponds to the boundary of the target T1. Figure YYY shows the geometry of the target T1 and the sensitive detector DDNT1. If the target size was increased, it would eventually intersected the detector DDNT1 at a distance of 25.8 mm from the beam center. A 1.4 mm wide stripe of low counts is visible on DDNT1 that is a result of the target's thickness of 1.016 mm and the 45 degree angle of intersection. (<math>1.016 \sqrt{2}=1.44</math>). The edge of the target does not produce many positrons compared to the face of the target, and as a result you see the stripe. | ||
| + | |||
| + | insert paragraph about angles | ||
The distance from the back of T1 to the detector is 25.8 mm. DDNT1T1 is 1.016 mm thick, and the projected thickness of T1's thickness on the detector DDNT1 is 1.4 mm | The distance from the back of T1 to the detector is 25.8 mm. DDNT1T1 is 1.016 mm thick, and the projected thickness of T1's thickness on the detector DDNT1 is 1.4 mm | ||
Revision as of 22:37, 24 April 2013
In G4beamline manual "The electromagnetic processes of these physics lists are advertised to be valid above a few hundred electron Volts; Geant4 has a set of low energy electromagnetic processes, indicated by a suffix “_EMX” in the physics list name."
2 MeV Positrons
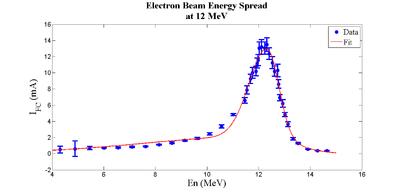
Measured Electron energy distribution at 10 MeV on 1.mm target
Simulation steps
1.) GEANT4 Simulated Beam energy distribution
2.) GEANT4 Simulated Positrons emitted from 1.x mm thick target
3.) Now use above Positron distribution as the particle source for G4beamline
Positrons hitting Tungsten Converter target
4.) Use GEANT4 to determine 511s from the positrons distribution impinging converter target
Oct 16th 2012 BenchMark
stages:
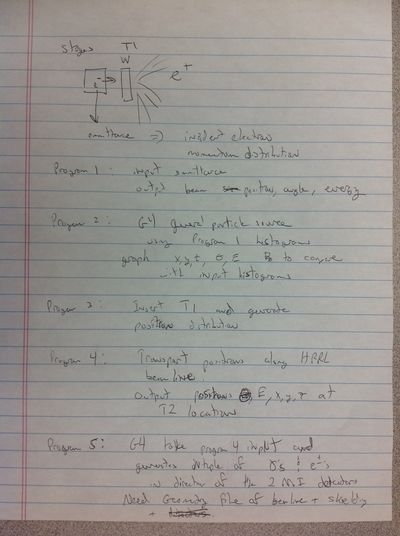
1. Program to input emittance, output beamsize, beam, divergence and beam energy.
2. e- on W, outcome e+. Incident electron distribution on T1. with general particle source with step 1 histogram. check graph x, y, z theta, En_dis out_put is the input. (directory for each).
3. insert T1 and generate positron distribution.
4. Acceleractor code to transport positron along the beamline. Out put positron theta, beamsize (x,y), energy distribution, out puts transported positron.
5. Geant4 takes step 4 output generates gamma (and other e+,e-) and look at those goes to detectors. beamline, plus shielding, and detectors.
Simulations
Partical Data Ground ID: PDGid=11 is electron. PDGid=-11 is positron. PDGid=22 is photon.
Parameters
Dipole vacuum chamber width is mm
The cavity exit diameter is about 7.3 mm.
Energy Spread Two Skewed Gaussian Fit
Energy spread fitted with two skewed Gaussian.
Beam Distributions Beyond RMS: Media:Beam_Distributions_Beyond_RMS.pdf
Amplitude = 2.13894, mean = 12.07181, sigma_L = 4.46986, sigma_R = 1.20046
Sigma = 2.83516, Es = -0.57658
rms = 2.56472, skew = -0.94853
Amplitude2 = 10.88318, mean2 = 12.32332, sigma_L2 = 0.69709, sigma_R2 = 0.45170
Sigma2 = 0.57440, Es2 = -0.21360
rms2 = 0.56719, skew2 = -0.34231
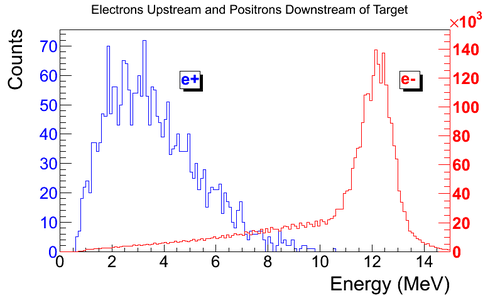
Electron Distribution Upstream and Positron Distribution Downstream of Target1
simulation: Electron Distribution Upstream and Positron Distribution Downstream of Target1
3067274 Electrons fired.
T1_s=943.5
FDT1_s=$T1_s-26.52
BDT1_s=$T1_s+26.52
Thickness of T1 is 1.016 mm, radius of T1 is 15.875 mm (0.625 inches).
Step 1: Generating positron from electron beam
Detector is after T1 to saple positron distribution. 1,379,974,500 electrons shot at the tungsten target to generate positrons.
step 1: ratio
DDNT1 = Detector DowN from T1
DQ4 = Detector at entrance Quad 4 located right after T1
DD1 = Detector at entrance of the first Dipole.
e-(DDT1)/e+(DDNT1) = 1248
e-(DDT1)/e+(DQ4) = 123698
e-(DDT1)/e+(DD1) = 936846
e+(DDNT1)/e+(DQ4) = 99
e+(DDNT1)/e+(DD1) = 750
e+(DQ4)/e+(DD1) = 7.6
Step 1: Generated Beam on DDNT1
Detector down T1:
Positrons on detector right before Q4.
Y profile (why is the distribution clipped on the left side in the figure) 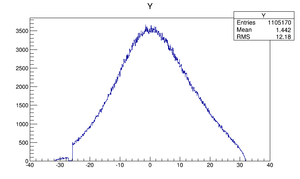
Sharp drop issue
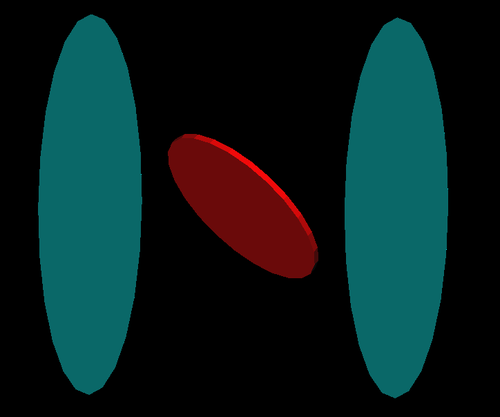
The Y-position distribution of the beam shown in Figure XXXX has a sharp drop in the region between -25.8 mm and -27.2 mm that corresponds to the boundary of the target T1. Figure YYY shows the geometry of the target T1 and the sensitive detector DDNT1. If the target size was increased, it would eventually intersected the detector DDNT1 at a distance of 25.8 mm from the beam center. A 1.4 mm wide stripe of low counts is visible on DDNT1 that is a result of the target's thickness of 1.016 mm and the 45 degree angle of intersection. (). The edge of the target does not produce many positrons compared to the face of the target, and as a result you see the stripe.
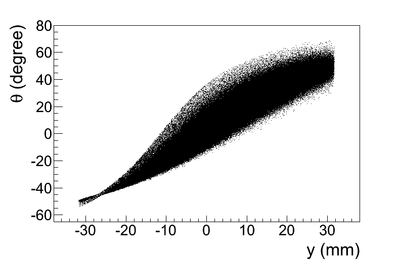
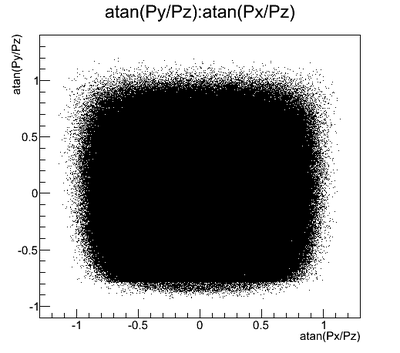
insert paragraph about angles
The distance from the back of T1 to the detector is 25.8 mm. DDNT1T1 is 1.016 mm thick, and the projected thickness of T1's thickness on the detector DDNT1 is 1.4 mm
The positrons created in the T1 has small probability to make to the strip area, because they need to travel through thick tungsten in that direction. Only the few positrons created on the lower edge of the T1 can make to the strip area. The positrons observed for y < -27.2 mm are the positrons passed through the upstream side of the T1.
Cut off line is around 26.5 mm corresponding to the large angle.
DDNT1 is at 26.52 mm (53.04 mm)downstream of T1.
T1 radius is 25.4 mm (d=50.8 mm)
DDNT1 radius is 31.75 mm (d=63.5 mm).
Step 1: Generated Beam on DQ4
Positrons on detector right before Q4.
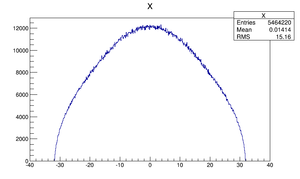
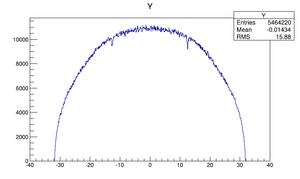
Step 1: Generated Beam on DD1
Positrons on detector right before D1 - first dipole.
Step 2: generate positron
The positrons after T1 is detected on a virtual detector. The positrons beam size, divergence and momentum distributions are extracted and created new positron beam.
Generate positron beam from the detector after T1 and transport it to right before D1.
221032400*16=3,536,518,400 positrons generated.
step 2: ratio
e+(DDNT1)/e+(DQ4) = 3536518400/47788670 = 74
e+(DDNT1)/e+(DD1) = 3536518400/5464220 = 647
e+(DQ4)/e+(DD1) = 8.7
Generated Beam on DQ4
Positrons on detector right before Q4.
Generated Beam on DD1
Positrons on detector right before D1 - first dipole.
Beam Compare Step1 and Step2
Compare Ratio
| S1 | S2 | |
| e-(DDT1)/e+(DDNT1) | 1248 | |
| e-(DDT1)/e+(DQ4) | 123698 | |
| e-(DDT1)/e+(DD1) | 936846 | |
| e+(DDNT1)/e+(DQ4) | 99 | 74 |
| e+(DDNT1)/e+(DD1) | 750 | 647 |
| e+(DQ4)/e+(DD1) | 7.6 | 8.7 |
Positrons at DDNT1
| Step 1 | Step 2 | |
| X profile | 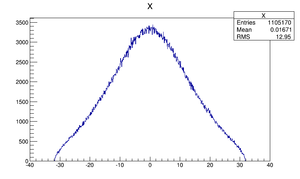 |
|
| Y profile |  |
|
| X divergence profile | 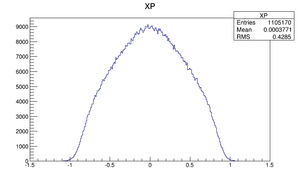 |
|
| Y divergence profile | 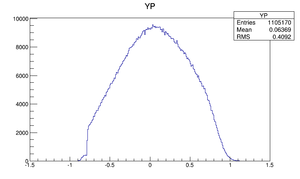 |
|
| Momentum distribution | 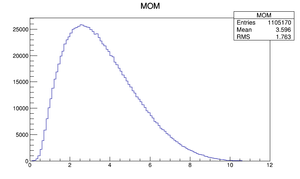 |
|
| Momentum distribution | 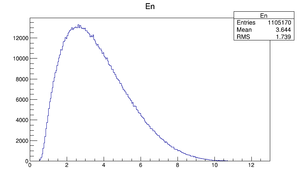 |
Compare at DQ4
| Step 1 | Step 2 | |
| X profile | 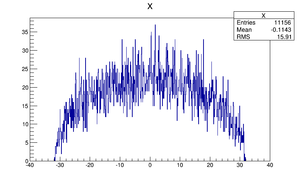 |
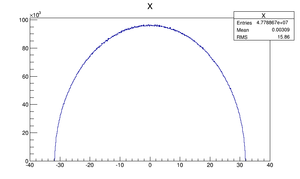
|
| Y profile | 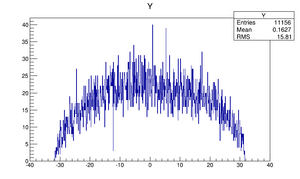 |
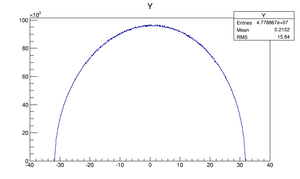
|
| X divergence profile | 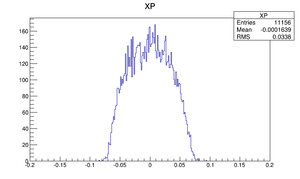 |
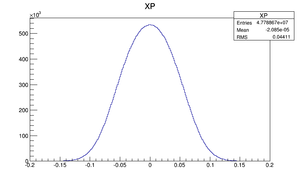
|
| Y divergence profile | 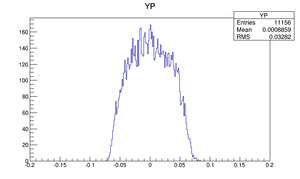 |
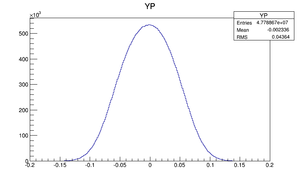
|
| Momentum distribution | 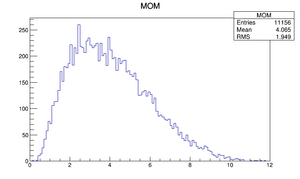 |
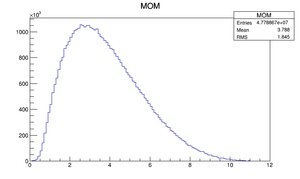
|
| Momentum distribution | 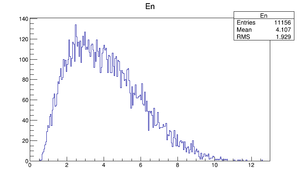 |
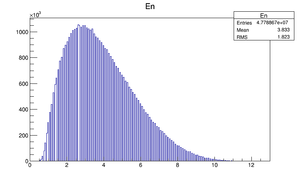
|
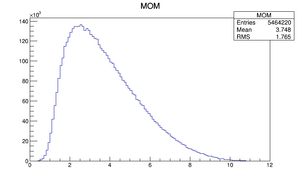
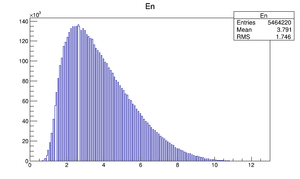
Compare at DD1
| Step 1 | Step 2 | |
| X profile | 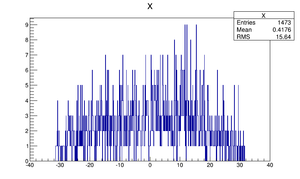 |
|
| Y profile | 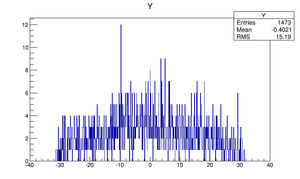 |
|
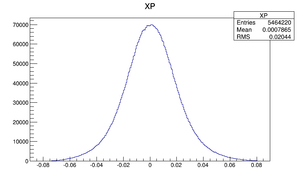
| X divergence profile | 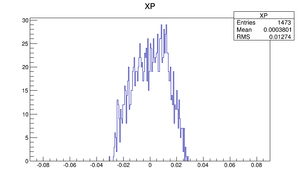 |
|
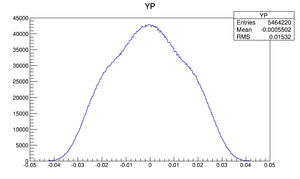
| Y divergence profile | 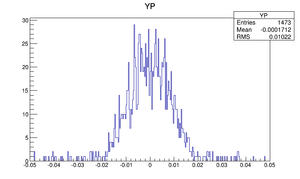 |
|
| Momentum distribution | 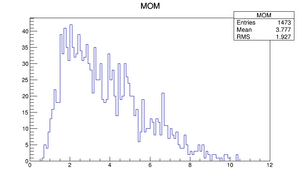 |
|
| Momentum distribution | 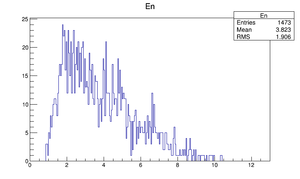 |
|
