Difference between revisions of "DU Run"
| Line 88: | Line 88: | ||
[[File:Sperical_coordinates_plot.gif]] | [[File:Sperical_coordinates_plot.gif]] | ||
| + | |||
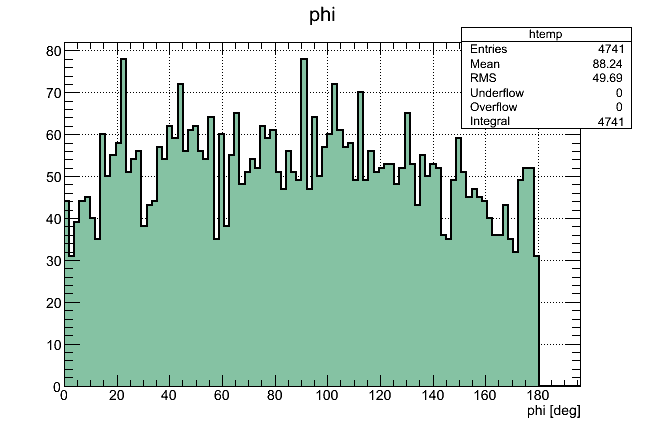
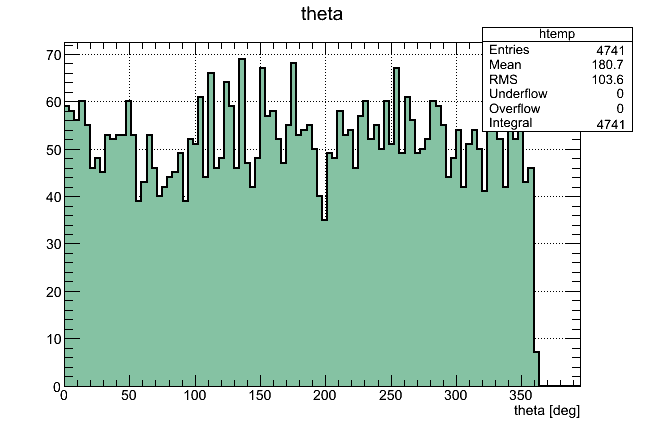
| + | The simulation of neutron angular distribution has been done using D2 sphere of diameter 6 cm and monoenergetic 5 MeV photn beam. The neutrons were observed outside of the sphere. The physics for neutron interaction with the matter was off to prevent the materil of the target to obscure the angular distribution. | ||
| + | |||
| + | In these coordinates the neutron angular distribution lokks like: | ||
| + | |||
| + | [[File:neutron_angle_phi.png]] | ||
| + | |||
| + | [[File:neutron_angle_theta.png]] | ||
Revision as of 15:21, 2 November 2012
Angular dependence of two neutrons emitted from DU target was determined.
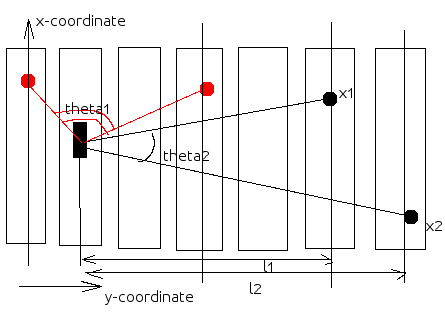
The angle was measured as shown below in the picture:
The dot product of two vectors , and .
For instance, for the case and the angle is , where 37.5 cm is the x-middle coordinate (the reference point of the coordinate system), the x-zero is at the bottom and x-top is 75 cm is the active area size.
The target was considered to be the point. There was no resolution along y-coordinate of the hit of each detector. All hits were assumed to hit the y-center of each detector.
The angle was measured as shown below in the picture:
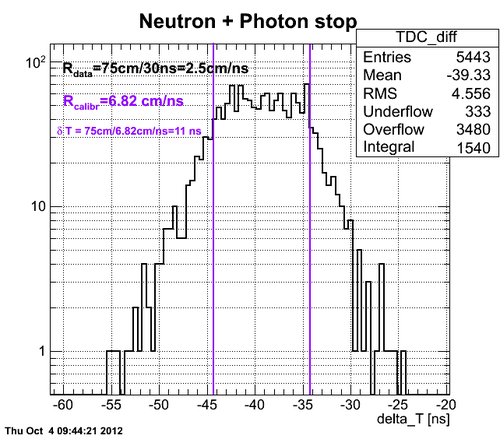
The X-coordinate of the neutron hit of each detector was determined from the TDC difference spectra with application of real calibration factors obtained in separate experiment with Co-60 source. As an example of the cuts applied see the plot below:
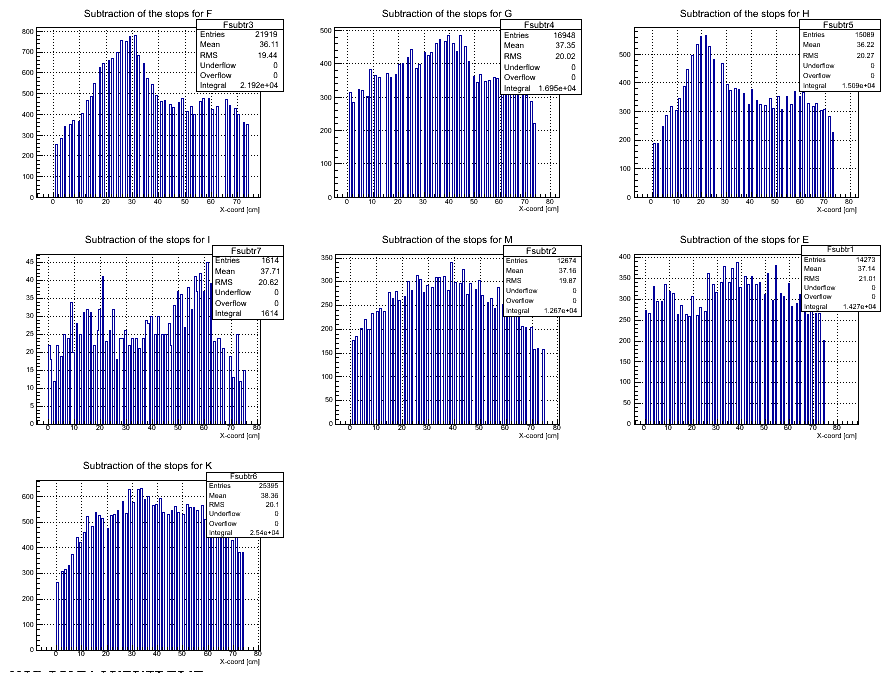
The data from the current run 4118 are plotted below:
And the same data on the linear scale:
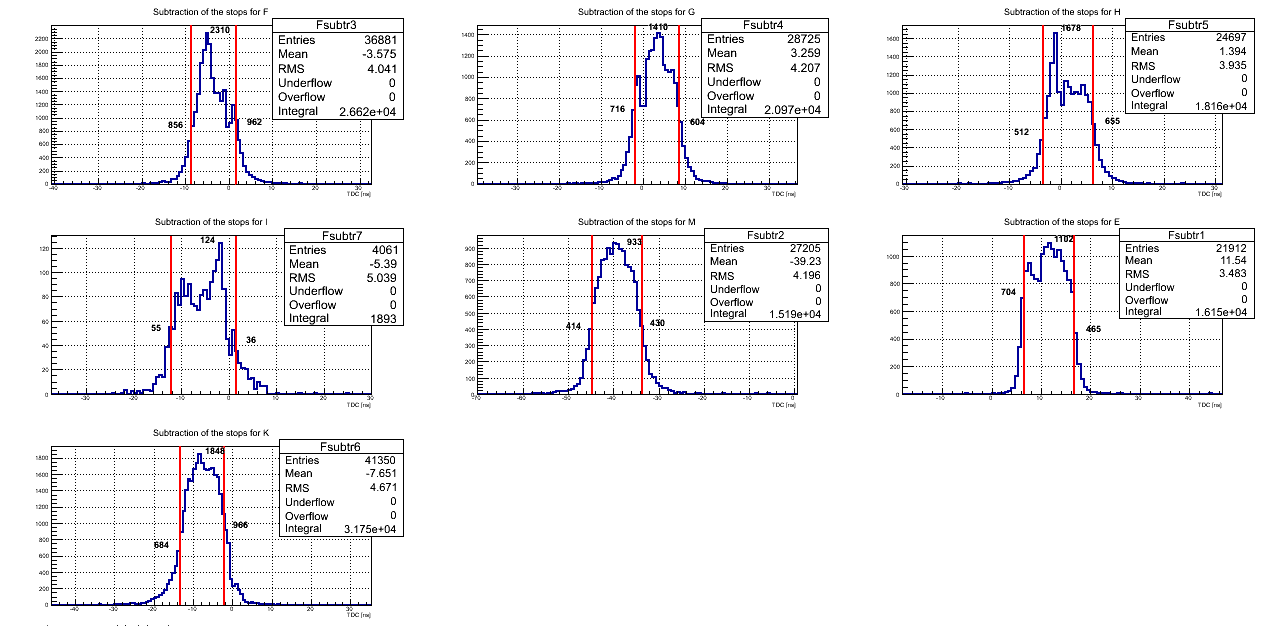
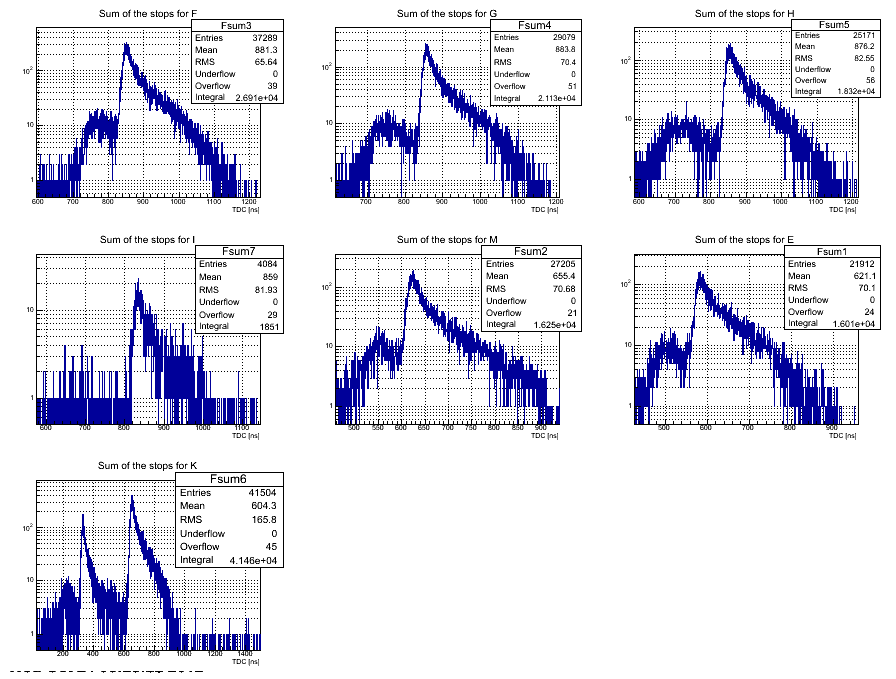
The timing cuts were applied for TDC sum spectra. It should be noticed that time cuts included both neutron and photon areas because in four fold coincidences the photon accidentals will dissappear.
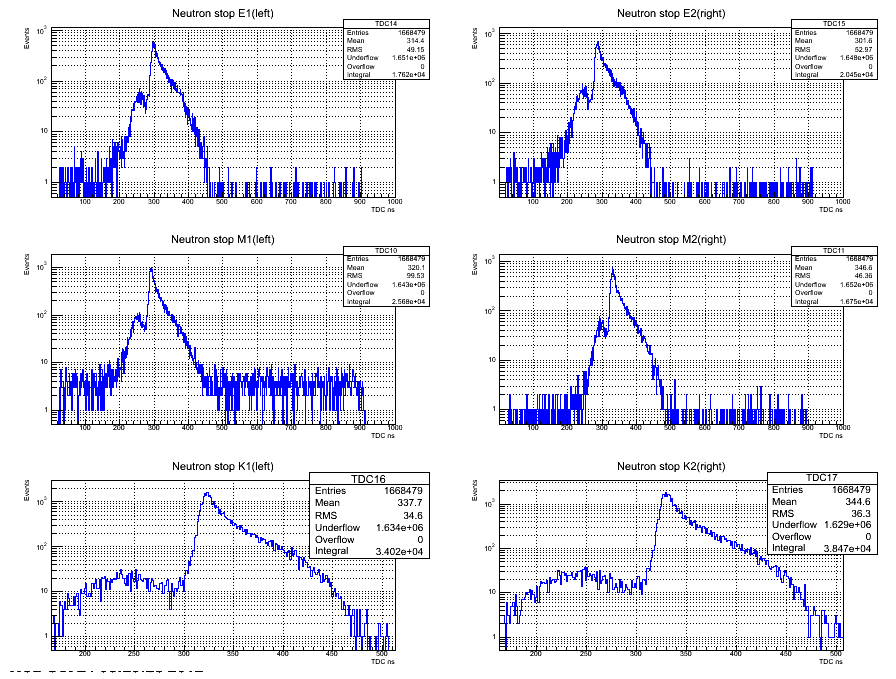
In the case of Det K it was hard to observe the neutron area and the TDC singles spectra were used to set the time cut (see Det K data on the plot below):
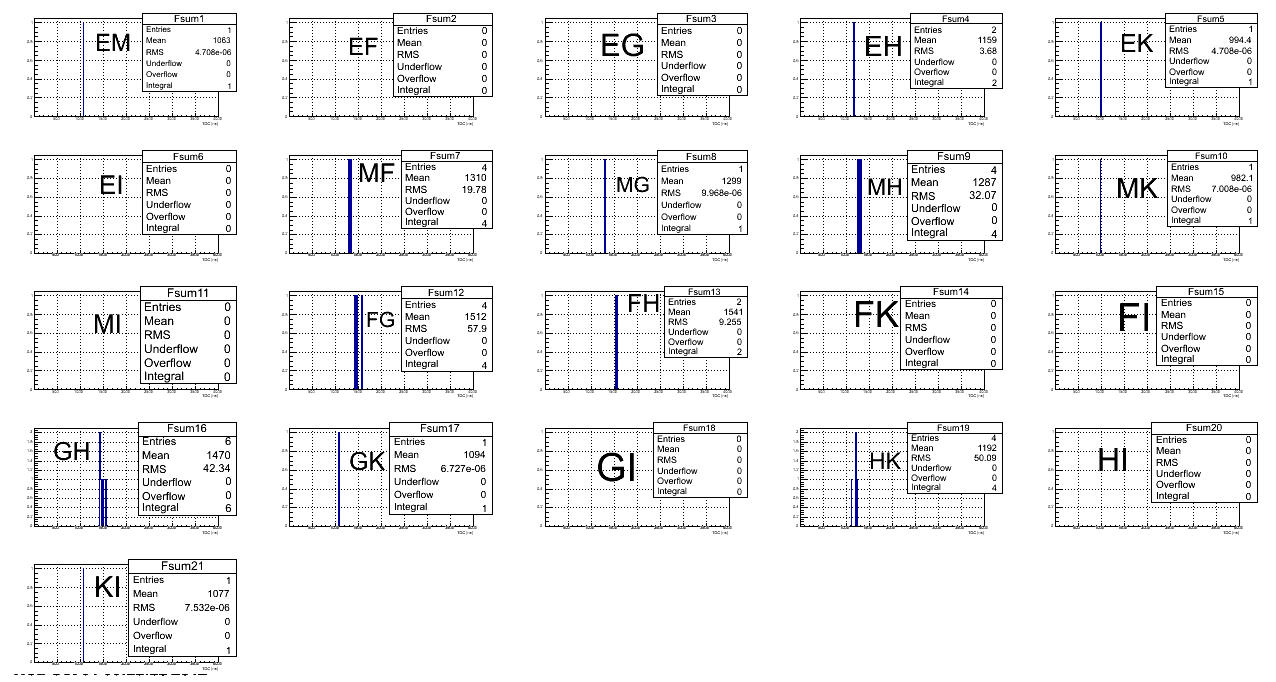
If we make 4x coincidences between the detectors with the timing cut on the neutron region only (no conditions applied on the x-ccordinate hit), we'll get
The total number of coincidences is 31.
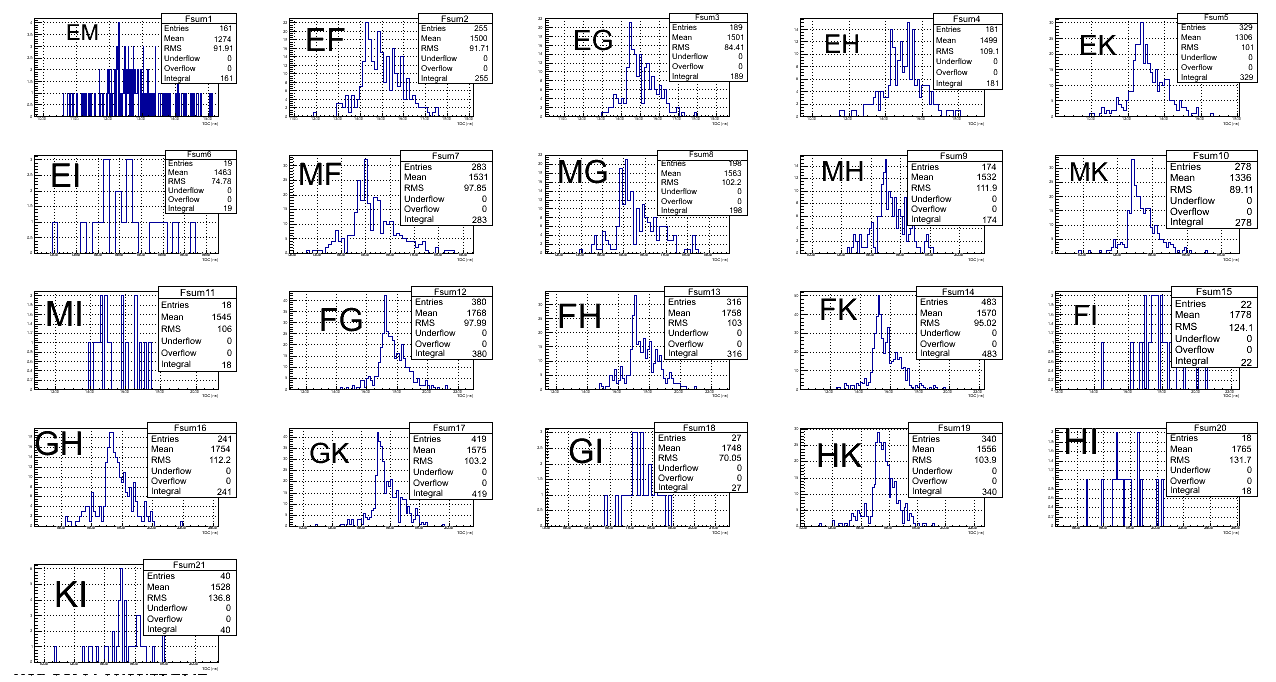
If we make 4x coincidences between the detectors with the timing cut on the neutron and photon regions (no conditions applied on the x-ccordinate hit), we'll get
The total number of coincidences is 4371.
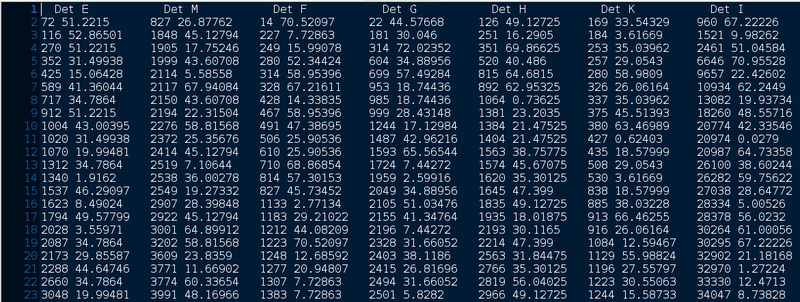
The data bank was created for single run and file looked like the one on the picture below:
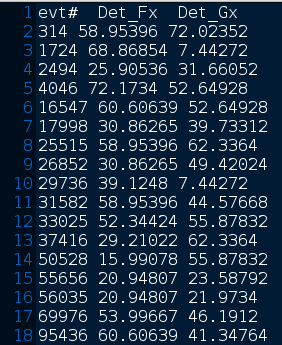
The first column of data obtained for each detector is the event number and the second one is the x-coordinate of neutron hit.
After processing of the main data bank the 2n coincidences were extracted for each possible detector hit combinations. The example of the data file for 2n coincidences of Det F and Det G is presented below:
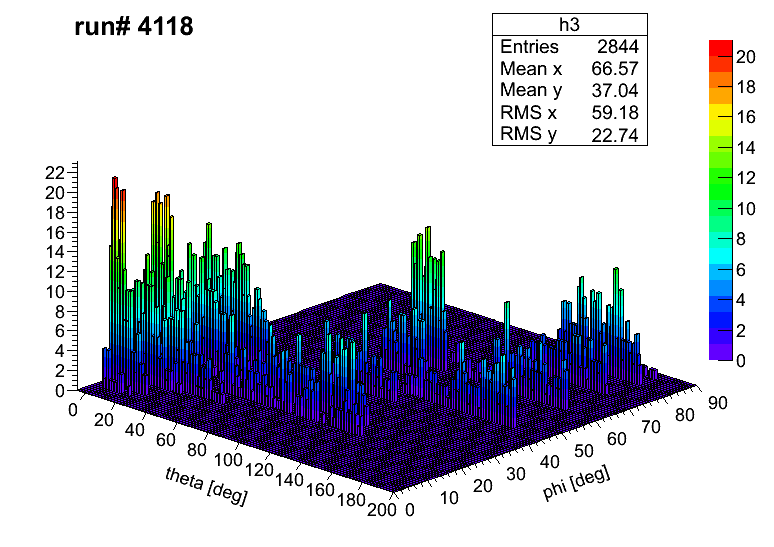
After writing a bunch of scripts the root file was created and the data are plotted below:
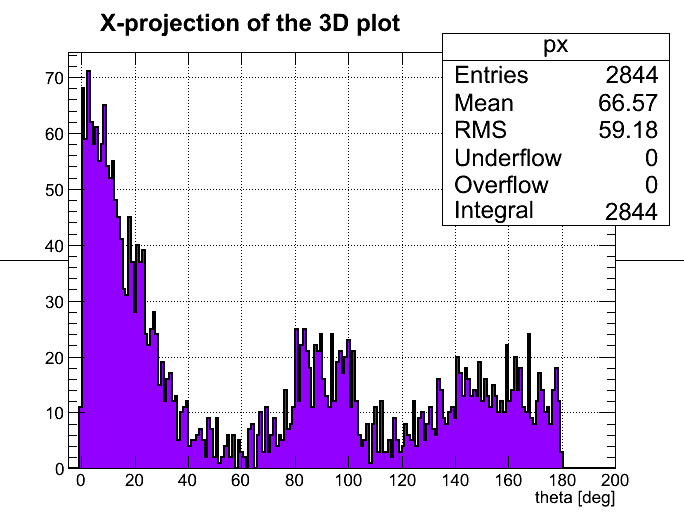
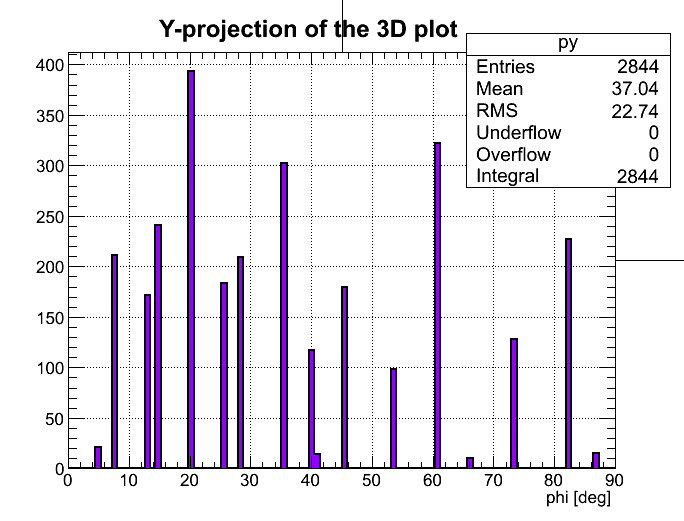
In order to see better and distributions it was created a couple of plots with corresponding projections:
projection of the 3D plot
projection of the 3D plot
The uncertainties on the angle are determined by the width of the neutron detectors and the distance from the target.
The uncertainties on the angle are determined by the width of the TDC difference spectra. Should be discussed.
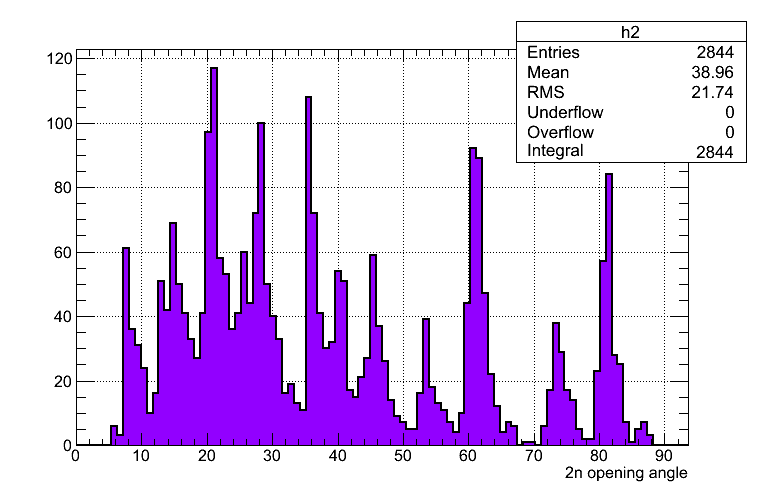
The 2n opening angle after taking in th account the z-coordinate of the vertex and timing cuts including both neutron area and photon region:
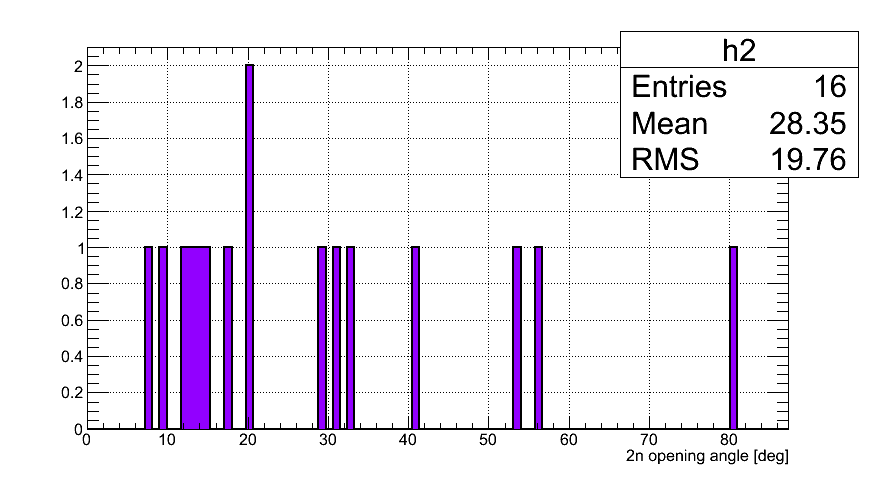
The 2n opening angle after taking in th account the z-coordinate of the vertex and timing cuts including neutron region only:
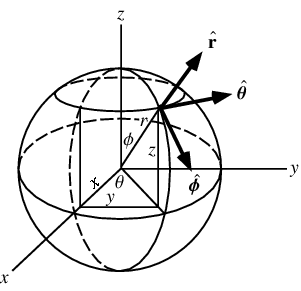
Spherical coordinates [Weisstein, Eric W. "Spherical Coordinates." From MathWorld--A Wolfram Web Resource. http://mathworld.wolfram.com/SphericalCoordinates.html ]:
The simulation of neutron angular distribution has been done using D2 sphere of diameter 6 cm and monoenergetic 5 MeV photn beam. The neutrons were observed outside of the sphere. The physics for neutron interaction with the matter was off to prevent the materil of the target to obscure the angular distribution.
In these coordinates the neutron angular distribution lokks like:
