Difference between revisions of "HRRL radiation tests"
| Line 13: | Line 13: | ||
[[Media:exposure-measurements-20090204.pdf]] | [[Media:exposure-measurements-20090204.pdf]] | ||
| − | Dose rates in mrad/hr at each of the 15 locations can be estimated by subtracting column 2 from column 3, averaging over the 5 dosimeters, and multiplying the result by (60 min/hr) / (94 min) | + | Dose rates in mrad/hr at each of the 15 locations can be estimated by subtracting column 2 from column 3, averaging over the 5 dosimeters, and multiplying the result by (60 min/hr) / (94 min). RMS spreads refer to variations in each group of 5. |
{| | {| | ||
| − | ! Location !! Dose rate | + | |- align=right |
| − | |- | + | ! width="150pt" | Location !! width="150pt" | Dose rate !! width="150pt" | RMS spread |
| − | ! !! (mrad/hr) | + | |- align=right |
| − | |- | + | ! !! (mrad/hr) !! (mrad/hr) |
| − | | 1 || | + | |- align=right |
| − | |- | + | | 1 || 9 || 4 |
| − | | 2 || | + | |- align=right |
| − | |- | + | | 2 || 396 || 57 |
| − | | 3 || | + | |- align=right |
| − | |- | + | | 3 || 7940 || 204 |
| − | | 4 || | + | |- align=right |
| − | |- | + | | 4 || 2831 || 117 |
| − | | 5 || | + | |- align=right |
| − | |- | + | | 5 || 4408 || 373 |
| − | | 6 || | + | |- align=right |
| − | |- | + | | 6 || 29339 || 3332 |
| − | | 7 || | + | |- align=right |
| − | |- | + | | 7 || 72517 || 687 |
| − | | 8 || | + | |- align=right |
| − | |- | + | | 8 || 36507 || 4746 |
| − | | 9 || | + | |- align=right |
| − | |- | + | | 9 || 5 || 5 |
| − | |10 || | + | |- align=right |
| − | |- | + | |10 || 37 || 4 |
| − | |11 || | + | |- align=right |
| − | |- | + | |11 || 164 || 40 |
| − | |12 || | + | |- align=right |
| − | |- | + | |12 || 2734 || 313 |
| − | |13 || | + | |- align=right |
| − | |- | + | |13 || 5828 || 120 |
| − | |14 || | + | |- align=right |
| − | |- | + | |14 || 7793 || 2579 |
| − | |15 || | + | |- align=right |
| + | |15 || 62431 || 27155 | ||
|} | |} | ||
Revision as of 20:42, 6 July 2009
Building a new positron beamline in the HRRL cell might require moving the linac itself. To help assess whether this is feasible with current shielding, radiation levels were measured on Feb 4, 2009 by M. Balzer and G. Stancari.
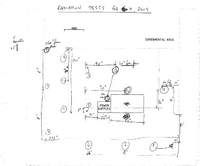
The HRRL was set at 15 MeV beam energy, 20 mA peak current, 1 kHz repetition rate, and 30 ns pulse width. Five OSL dosimeters were placed at each of 15 locations in the cell. Locations are marked on the following map:
Media:dosimeter-locations-20090204.pdf
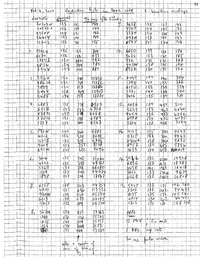
Readings in mrad are reported in the following table. They were taken before exposure (first column) and after a couple of minutes of machine tuning (second column). Readings in the third column were taken 94 minutes after the second reading. During these 94 minutes, the machine was running with the settings mentioned above.
Media:exposure-measurements-20090204.pdf
Dose rates in mrad/hr at each of the 15 locations can be estimated by subtracting column 2 from column 3, averaging over the 5 dosimeters, and multiplying the result by (60 min/hr) / (94 min). RMS spreads refer to variations in each group of 5.
| Location | Dose rate | RMS spread |
|---|---|---|
| (mrad/hr) | (mrad/hr) | |
| 1 | 9 | 4 |
| 2 | 396 | 57 |
| 3 | 7940 | 204 |
| 4 | 2831 | 117 |
| 5 | 4408 | 373 |
| 6 | 29339 | 3332 |
| 7 | 72517 | 687 |
| 8 | 36507 | 4746 |
| 9 | 5 | 5 |
| 10 | 37 | 4 |
| 11 | 164 | 40 |
| 12 | 2734 | 313 |
| 13 | 5828 | 120 |
| 14 | 7793 | 2579 |
| 15 | 62431 | 27155 |
Back to Positrons

