Difference between revisions of "DDP:Detailed Design Phase: Drawing and Assembly Package"
| Line 54: | Line 54: | ||
== End Plate == | == End Plate == | ||
====Dimensions==== | ====Dimensions==== | ||
| − | |||
| − | |||
| − | |||
| − | |||
| − | |||
| − | |||
| − | |||
| − | |||
| − | |||
| − | |||
| − | |||
| − | |||
| − | |||
| − | |||
| − | |||
| − | |||
| − | |||
| − | |||
| − | |||
| − | |||
===Back Plate=== | ===Back Plate=== | ||
Revision as of 16:56, 22 July 2008
Detailed Design Drawing Report 6/27/08
Introduction
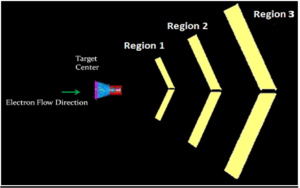
The CLAS12 Drift chamber has 3 regions arranged as shown below
The electrons scatter from the target center will travel through region 1, region 2 and region 3. All these regions look the same way. However, their sizes and the materials with which they are made are different. Due to the fact their sizes are different; some of them have some structural add-ons to support their structural abilities. The chambers are arranged in such a way that every chamber receives the same number of electrons. Apart from that, the chambers were shaped in such a way that all the electrons travel approximately the same distance before they hit a particular chamber.
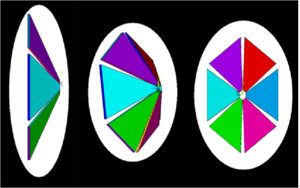
Each and every chamber has 6 equal sized pieces which are shaped similar to a triangular piece. All of these pieces are arranged and bowed inward to resemble sectors in a 6 sector umbrella.As discussed before, each region will be sized different. Region 3 will be the biggest of all, as region 3 has to cover a larger electron span (surface area).
Although these pieces are termed as triangular, these are not triangular in reality. The nose which is the smallest of all is very small compared to the other plates, which will make us to visualize this as a triangular piece. Ar Co2 (90/10) gas is maintained in each of these chambers at an operating pressure of 0.001444 Psi and a peak pressure 5 times higher. In turn there are about 4928 wires (112 Sense wires with 44 Wire Layers) connected across the plates inside each piece.
Design Criteria
Initial parameters to be followed to fulfill to satisfy design Criteria
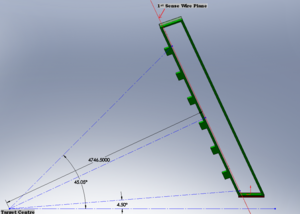
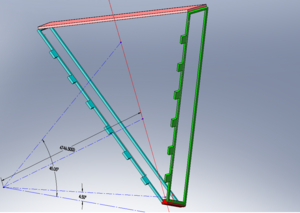
| Distance from target to first sense wire plane along a ray which is normal to the end plate | 25 Degrees | |
| Chamber Tilt Angle | 25 Degrees | |
| Maximum Scattering Angle | 45.05 Degrees | |
| Minimum Scattering Angle | 4.5 Degrees | |
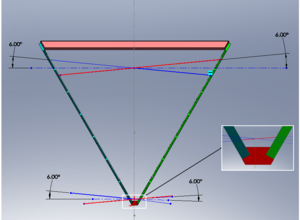
| Angle of the wires to the horizontal | 6 Degrees |
Introduction to Assembly
Paragraph defining all the parts
Nose Plate
End Plate
Dimensions
Back Plate
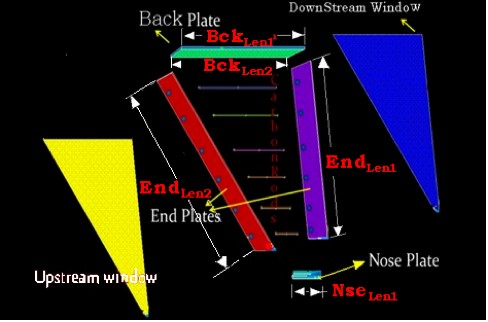
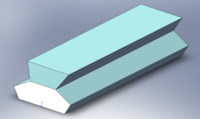
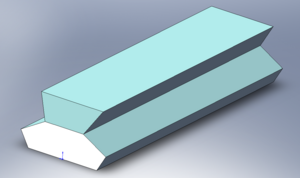
Nose Plate will be made of rigid material such as solid aluminum, since the supporting mechanism will be attached to these plates. The nose plate will connect the bottoms of the two end plated and provides the interface.
The End plate is about 4830 mm and 4665mm in length along the longitudinal length and about 525mm in width. It has approximately about 5000 holes with an approximate diameter of 6mm on the surface and about 9mm inside the surface. There will be two End plates names as Right End plate and Left End plate which are located to the actual right and left side of each sector when viewed from the target center respectively.
Back Plate: 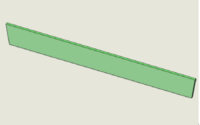 It is the plate which connects the top edges of both the end plates and holds the fixtures settings
To provide rigidity, there will be several carbon rods fixed in between both the end plates and they vary in length depending on no.of carbon rods used and the location of rods. These rods are hollow to reduce the electron dissipation in the section.
Upstream Window and Downstream Window's: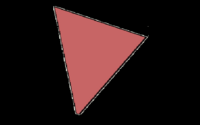
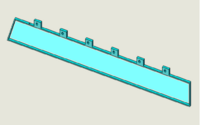
Upstream Window is the thin Mylar sheet of about 1/1000th of an inch crimped or glued on the upstream side of electron flow slightly after the carbon rods. Downstream Window is a Hexcel honeycomb material provided on the downstream side to help support the assembly, to provide rigidity and to enclose each sector
Analysis
To determine the stability of the design, various sets of analysis were performed under different constraint and loading conditions. Sometimes each of the part was analyzed individually and also in the assembly. Some parts were analyzed for different materials
Part Analysis
These are those analysis were individual parts were analyzed under various loading and constraint conditions. Some of the constraints were assumed to understand the influence of each constraint, material and load. supportive manual calculations were also compared with these analysis in few cases.
End Plate
End plate was considered in 2D and 3D with various thicknesses and various materials, supports and constraints
Point Load Deflection
A simple back-of-the-envelope calculation for deflection was performed assuming aluminum endplates and a point-load force (representing the distributed force from the wires into a single load). The force on an endplate due only to the tension from the 4,928 wires is about 5700 N /2. A simple calculation based on the definition of Young's modulus can yield an order-of-magnitude-level estimate for the deflection of an aluminum endplate in which the wires exert a force perpendicular to the endplate. The deflection of the endplate in terms of Young's Modulus is given by the equation:
where
- Young's Modulus for Aluminum
- point force/load
- width of the endplate
- deflection of endplate due to point force
- length of the endplate
- thickness of the endplate
By substituting in the above values and solvign the equation, a deflection of 7 mm is expected for a 5 cm thick aluminum endplate. If a 5 cm thick stainless steel endplate were used, the deflection would decrease from 7 mm to 2.5 mm (due to the linear dependence of the deflection on the Young's Modulus). The previous work performed by Kevin Folkman at the IAC came to a similar conclusion.
Distributed Load Deflection
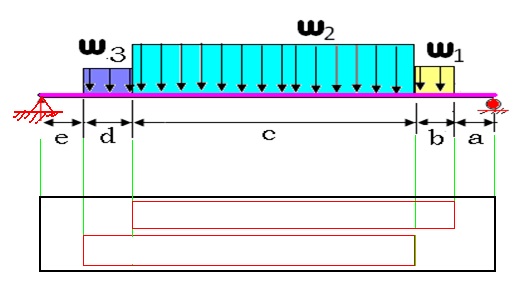
The endplate deflection calculations were refined to a more realistic case in which the load is distributed evenly along the endplate. The tension of the wires on the endplate was divided into three regions; W1,W2, and W3. The load W3 corresponds to a region along the endplate in which wires from both super layers are creating a load on the endplate. Loads W1 and W2 represent regions in which only a single super layer is causing a load. The endplate is "simply" supported in order to calculate the deflection. The term "simply supported" implies that one side (left side of an endplate for this case) may rotate but not translate (resulting in two reaction forces) whereas the other side (the right side of and endplate for this case) is supported such that it may rotate and translate (resulting in a single, normal reaction force). Figure 7 labels the loads as well as distances over which the loads are applied on the end plate. A total force of 340 lbs exerted by the drift chamber wires is decomposed into its components according to the angle made by the wire on the endplate.
The following calculations are in accordance to a standard approach covered in all undergraduate "Mechanics of Materials" engineering courses. This method is based on integrating the elastic curve equation for a beam. The equation of the elastic curve relates deflection (y) to Moments (M) at given linear locations along the beam (x):
where represents Young's Modulus and is the Area Momentum of Inertia. The Area Moment of Inertis is defined as the second moment of an area about a given axis:
- Area moment of inertia about the x-axis.
The mass moment of Inertia is defined as:
In order to perform these calcuations, the following assumption were made:
- The end plate is made of homogenous uniform elastic material with a Young's Modulus of (Stainless Steel).
- The horizontal component of the loading is completely neglected.
- The deflection in the x-direction is negligible.
- The end plate is rectangular in shape with a width of 526 mm and thickness of 50.8 mm resulting area moment of inertia () =5746.4 .
- The loading provided by wire tensions are equivalent to a uniformly distributed load.
- The maximum deflection occurs along the length which is represented by in the diagram.
- The loading applied is under the elastic limit of the material.
- The effects of the endplate weight are ignored.
The moments experienced along the endplate may be divided into 5 separate equations, each equation valid only for its corresponding region:
where represents the linear distance along the endplate. If we assume that the largest magnitude of deflection occurs in region c, then we may integrate the above 2nd order elastic curve equation once and determine the critical point which represents the point of maximum deflection ( contra flexure).
- =
where a constant of integration. Integrating the equation a 2nd time will result in an equation for the amount of the deflection. The constants of integration my be found by applying boundary conditions at points where the deflection is zero (at the ends or and ).
Setting to zero and solving for x gives the linear distance corresponding to the point of maximum deflection of x = 1654.96 mm. In other words, the maximum deflection occurs 1654.96 mm from region of the endplate or mm from the right hand side of the endplate. Substituting the value of x above results in a maximum deflection of 2.2 mm. Note, this deflection is only slightly smaller than that found with a point load assumption and a stainless steel endplate (2.2 mm compared to 2.5 mm, respectively).
Distributed Load FEA
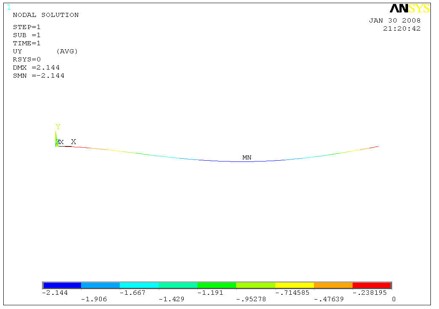
A Finite Element Analysis (FEA) was performed on the same stainless steel endplate design using the commercially available computer software ANSYS. For this analysis, the loading shown previously in the "Distrubuted Load" section was used. The maximum deflection observed from the FEA was 2.14 mm, as shown; this value differs from the hand calculation by only 3%. In addition to validating the FEA analysis with hand calculations, the above results also reveal the challenge of reducing the endplate deflection using stiffer materials due to an essentially linear dependence of the deflection on the Young's Modulus. The cubic dependence of the deflection on the thickness of the endplate, however, can be used to reach the minimum endplate deflection criteria of 50 , in addition to the us of stiffer material. Increasing the endplate thickness, however, comes at the cost of increasing the end plate mass. As a result, composite materials were considered in order to minimize weight. The performance of these composite materials is shown in the 3-D model section of this report.
|
| Figure: ANSYS FEA results for deflection of a stainless steel endplate design for a distrubed loading. |
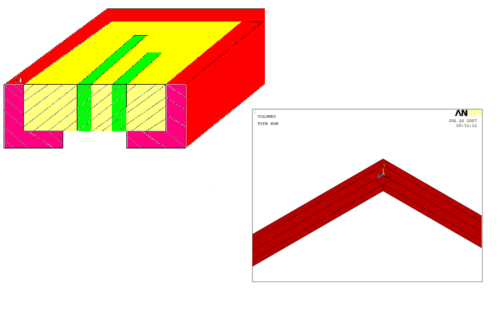
L Angular Support framing
|
| Figure: |
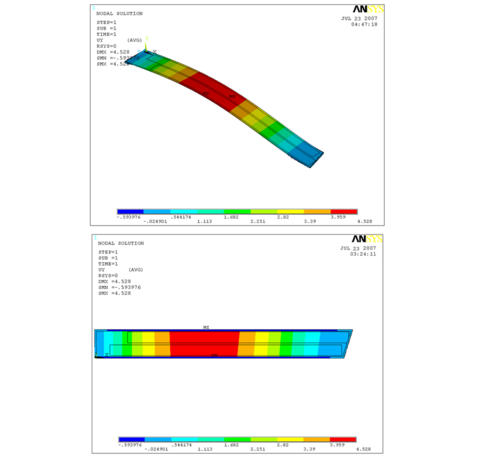
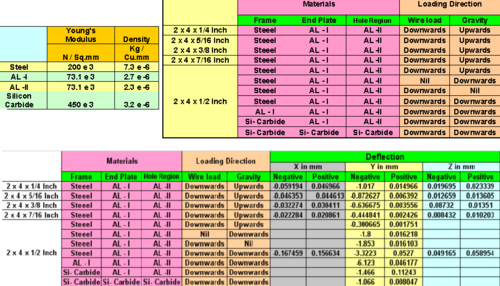
To provide support for the End plate against deflection, a 90 degrees bent L Angular is supported all around the end plate. The Non scale sectional view of the same is shown below. In this model the outer frame (shown in Red) is made of Wood pulp or paper with a very low Young’s modulus of 10 x 103 N/Sq.mm & Density of 8 x 10⁻⁸ kg/Cu.mm. Whereas the material shown in Yellow will be made of Aluminum 6061 T6 with Young’s modulus of 73.1 x 10³ N/Sq.mm & Density of 2.7 x 10⁻⁶ kg/Cu.mm and material shown in green will be the region with holes. For modeling purposes, this region is considered to be Aluminum 6061 with slightly lesser Density of 2.3 x 10⁻⁶ kg/Cu.mm A Load of 340 pounds is applied on each of these green strips at an angle of 55.92 & 67.92 degrees (counter wise clock direction) with the horizontal.
|
| Figure: |
|
| Figure: |
Composite End Plate
Effective Young's Modulus
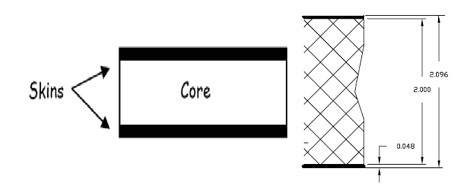
The R3 endplates used in the CLAS 6 GeV detector were comprised of a polyurethane foam core 50.8 mm thick (2 inches) with 1.2 mm thick (0.048 inch) stainless steel sheets epoxied to each side, as shown in Figure.
|
| Figure: Polyeurethane foam/stainless steel composite endplate construction and dimensions. |
An effective Young's Modulus () was used in the FEA model in order to simplify the model. The effective Young's Modulus for this endplate, weighted by the volume of each plate, is
where
- inches
- inches
Therefore, the effective Young's Modulus was found to be:
FEA Deflection Results
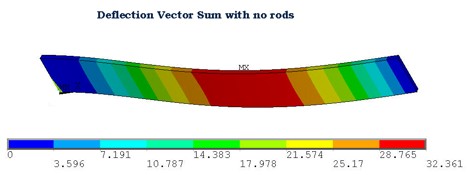
The effective Young's Modulus of was used to determine the deflection of the endplate due to a distributed load (see Figure 3.5.2). Results indicate a maximum transverse deflection of 32.4 mm which is larger than that observed with the stainless steel material. However, when gravity is included, the composite material will deflect less due to its lower density.
|
|
Fixing the carbon Rod locations on the end plate
In this analysis, the end plate is a straight rectangular shaped sheet. six carbon rods were assumed and the locations where the carbon rods are attached to the end plate are fixed for analysis. FR-3700 Foam with slices of steel is considered for this analysis. Effective Material properties were used wherever required. The short sided edges of the rectangular end plate is considered to be fixed pretending a cantilever beam.
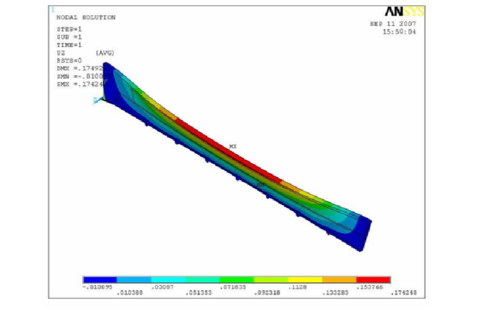
|
| Figure: |
Fixing both Carbon Rod and Hexcel side edges on the end plate
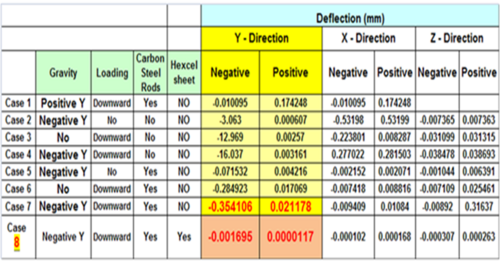
Deflection Analysis of the End plate (Slices of Polyurethane and Steel) with fixed carbon rods and Hexcel foam sheet edges
A Hexcel Foam Sheet HRH 10-1/8 -1/8 is introduced in the model to reduce the deflection. This sheet is pre impregnated with thin sheets of metal on either side along the face of the end plate. The layout can be assumed as 0.010 (Skin 1) + 1.520 (Core) + 0.010 (Skin 2) inches in thickness. In this analysis the carbon rods and Hexcel foam sheet are assumed to be completely restricting the movement on the edges
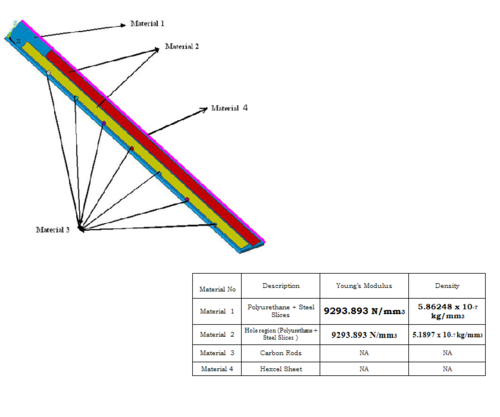
|
| Figure: |
Loading conditions:
• The regions shown as material 3 and material 4 are fixed with carbon rods and Hexcel foam sheet respectively
• The areas on the side view (face attached to the nose plate and the face attached to the face (top) plate) is also constrained for movement
• Load at 6 degrees on material 2 as usual
• Gravity downwards i.e. on –y direction
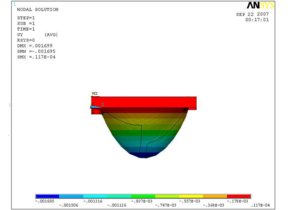
|
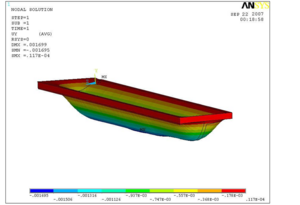
|
|
| Figure: |
Carbon Rod Buckling
A support brace composed of carbon rods was considered in order to reduce the larger deflections of composite endplates compared to endplates made from stainless steel. These rods would be used on the front side of the R3 drift chamber and span between the two endplates. The use of 1" diameter hollow carbon fiber rods with 2 mm thick walls in the 6 GeV R3 design did not appear to appreciably impact the tracking capabilities of the drift chamber. The deflection of these carbon fiber rods was modeled as a separate part in ANSYS and compared with hand calculation.
Compression
If one makes the assumption that the rod buckles by an external force along the length of the rod, then the compression of the rod can be calculated using the definition of Young's Modulus (Y) given by the equation:
where
- Compression force exerted along the end of the rod
- length of the rod = 2.8 m for the longest rod
- cross sections area of the rod =
- rod compression distance =
The force needed to cause the carbon fiber rod to buckle such that the endplate deflects can be estimated by assuming that the length of the rod (2.8 m) compresses by .
The total force along the whole endplate from just the drift chamber wire tension amount to less than 3000 N which is less than a factor of 2 smaller than the force needed to compress a single carbon rod used to brace the endplates. Therefore, placing at least 6 carbon rod braces in the drift chamber should provide substantial support for the endplates.
Buckling Load Threshold
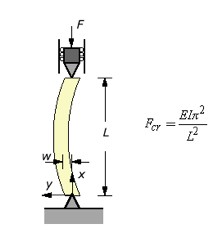
The load at which a carbon fiber rod will start to buckle is given by Euler's formula (defined in any undergraduate "Mechanics of Materials" textbook). Figure 4.2.1 depicts the load configuration on the rod for this calculation.
|
| Figure: Sketch showing the definition of Euler's buckling load threshold. |
represent the critical force needed to cause the rod to begin to buckle. Young's Modulus for a carbon fiber rod is 1.5 x 10^11 N/ and the longest rod's half length (L for the above equation) is 1.4 m. The Area Moment of inertia about the end of a hollow cylinder of inner radius and outer radius can be found from:
The buckling force is found to be 36,646N, an order of magnitude larger than the predicted endplate forces.
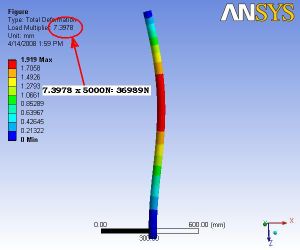
The above buckling threshold calculation was performed using ANSYS. The results predicted a threshold force of 36989 N compared to the 36646 N value found from hand calculations. ANSYS also predicts that the rod will deflect almost 2 mm if the buckling load is reached, no deflection due to buckling will occur before the load level is reached.
|
| Figure: FEA of the maximum (threshold) force needed to cause a carbon rod to buckle. |
Actual Buckling --- FEA
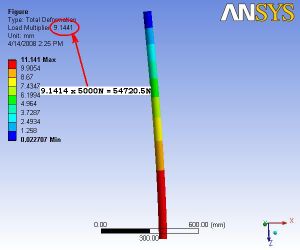
In the previous FEA results, both ends of the carbon rods were constrained from moving from x and y directions and does not account for the deflection of the endplates. If the endplates deflect the ends of the carbon rods will be compressed. The buckling load in this case is observed to be 54720.5N as shown below in the Figure. In the event that the buckling load is reached, ANSYS predicts a deflection of at least 11 mm will occur. It should also be noted that the buckling does not have a preferred direction making it possible for the middle of the rod to bend in any direction.
|
| Figure: FEA of the maximum (threshold) force needed to cause a carbon rod to buckle with the real constraints. |
Upstream Window (Mylar) Analysis
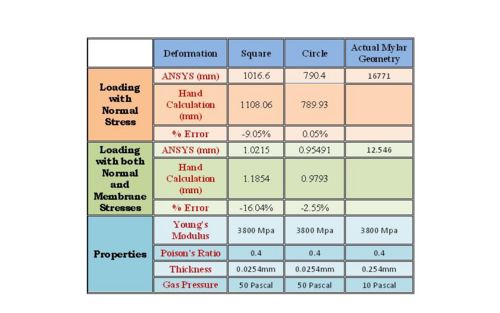
If the mylar thickness is increase by a factor of 10 (form 1/1000 of an inch to 1/100), ANSYS would predict a deflection of about 12 mm. Formula do exist for simple geometries such as a square and a circle but not a triangle. A hand calculation for a square which is a factor of 40 smaller in size to R3 predicts 1/1000 inch thick rectangular mylar sheet will deflect about 1 mm and a circle a little less than 1 mm. If you assume the R3 triangle geometry to be similar to a 4 m x 4 m square , the mylar sheet would deflect 17.2 cm referencing manual calculations. The max error observed between manual result and ansys result was -16 percent with other sections and sizes. so expecting the deformation will be between 14.5 cm to 17.2 cm. 14.5 cm being the deflection after considering the error.
The Mylar sheet on the upstream side of the Region III drift chamber was analyzed in ANSYS for FEA deformations and the results were justified by comparing with manual calculations.
Due to the fact that the Mylar sheet is extremely thin and week for FEA analysis and has complicated geometry to perform manual calculations, the analysis is slightly simplified.
• FEA analysis approach is justified by calculating the percentage error between FEA results and Hand Calculation results for some basic shapes with the actual thickness of 0.0254mm and the young’s modulus of 3800Mpa. A square sheet of 100 x 100 mm and a circular sheet of radius 50mm.
• The thickness of the Mylar sheet is increased from 0.0254mm to 0.254mm. This is done as ANSYS has a acceptable thickness to acceptable deformation ratio, with the specified thickness of 0.0254mm, the deformation is way over the deformation limit and ANSYS cannot handle the problem.
• For Very thin sheets like mylar, Large deflection membrane stiffened analysis is proven to be accurate and the same is otherwise termed as loading with normal and membrane stress approach and is detailed, Please follow the link Deformation with both Normal and Membrane Stress approach
Assembly Analysis
1. The orientations and results of the primary analysis were shown at the following link Kalyan_4-25-08
2. By modeling hexcel sheet in the assembly and by replacing the rectangular constraints with circular constraints, we have considerable change in the numbers for deflection and can be observed at kalyan_16_may_08
3. The Hinge locations were moved from Upstream side to the downstream side and the results can be observed at kalyan_23_May_08
4. To reduce the max deformation, the diameter of the carbon rods and the thickness were gradually increased and the results were tabulated as follows
| Deformation (mm) | |||||
| Sector 1 | E Max | D Max | X Max | Y Max | Z Max |
| 3 inch Dia, 0.1 Inch thk Carbon rods | 0.141 | 0.159 | 0.139 | 0.091 | -0.073 |
| 3.5 inch Dia, 0.1 Inch thk Carbon rods | 0.117 | 0.132 | 0.117 | 0.075 | -0.050 |
| 3.5 inch Dia, 0.2 Inch thk Carbon rods | 0.106 | 0.119 | 0.102 | 0.162 | -0.053 |
| 3.5 inch Dia, 0.3 Inch thk Carbon rods | 0.097 | 0.109 | 0.092 | 0.054 | -0.048 |
Follow the link for images and PDF result files. The new results can be observed at kalyan_23_May_08_2.1
5. An Extra carbon rod is introduced to the geometry on the downstream side behind the hexcel sheet with various diameters and thicknesses and the results can be found at kalyan_23_May_08_2.2
6. In the next approach, the thickness of the polyurethane layer in the end plates were increased from 2 inches to 2.5 inches with carbon rods of 3.5 inch diameter and 0.5 inch thk including the single rear carbon rod.
| Deformation (mm) | |||||
| Sector 1 | E Max | D Max | X Max | Y Max | Z Max |
| 3.5 inch Dia, 0.5 Inch thk Carbon rods with 1 rear rod and 2.5 Inch Polyurethane on end plates | 0.080 | 0.090 | 0.080 | 0.045 | -0.031 |
Follow the link for images and PDF result files. The new results can be observed at kalyan_23_May_08_2.3
7. The aluminum casing width is increased by 30 mm, This increase is made on the upstream side between the aluminum slits and upstream side hole area, Triangular constraint areas were introduced to the geometry and the constraints were applied on them.
Sector 1 is studied under 6 cases of analysis.
- Case 1: Triangular Constraints are only in the downstream side and only upstream side on the nose plate
- Case 3: Triangular Constraints are only in the upstream side and only upstream side on the nose plate
- Case 5: Triangular Constraints are in both upstream and downstream side and only upstream side on the nose plate
- Case 2, Case 4, Case 6: are with both upstream and downstream side constraints on the nose plate for case 1, 3, 5 respectively
For Details, Follow the link for images and PDF result files. The new results can be observed at kalyan_30_May_08
Drawings
List of drawings
| S. No | Drawing No | Description | Link |
| 1 | B00000-01-10-0001 | Basic sector assembly | File:B00000-01-10-0001.pdf |
| 2 | B00000-01-10-0002 | Detailed drawing of Nose plate | File:B00000-01-10-0002.pdf |
| 3 | B00000-01-10-0003 | Detailed drawing of right end plate Core | File:B00000-01-10-0003.pdf |
| 4 | B00000-01-10-0004 | Detailed drawing of right end plate skin | File:B00000-01-10-0004.pdf |
| 5 | B00000-01-10-0005 | Detailed drawing of End plate casing | File:B00000-01-10-0005.pdf |
| 6 | B00000-01-10-0006 | Detailed drawing of Left end plate Core | File:B00000-01-10-0006.pdf |
| 7 | B00000-01-10-0007 | Detailed drawing of Left end plate skin | File:B00000-01-10-0007.pdf |
| 8 | B00000-01-10-0008 | Detailed drawing of back plate Core | File:B00000-01-10-0008.pdf |
| 9 | B00000-01-10-0009 | Detailed drawing of back plate skin | File:B00000-01-10-0009.pdf |
| 10 | B00000-01-10-0010 | Detailed drawing of back plate casing | File:B00000-01-10-0010.pdf |
| 11 | B00000-01-10-0011 | Detailed drawing of back plate Core | File:B00000-01-10-0011.pdf |
| 12 | B00000-01-10-0012 | Detailed drawing of back plate skin | File:B00000-01-10-0012.pdf |
| 13 | B00000-01-10-0013 | Detailed drawing of carbon fiber rods | File:B00000-01-10-0013.pdf |
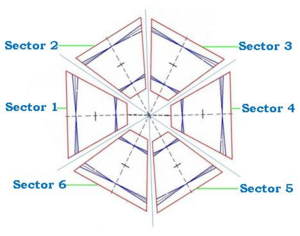
The Assembly of each sector in the region 3 drift chamber can be considered similar to each other.
Each assembly can be divided into sub-assemblies like
1. Nose Plate
2. Right End Plate
3. Left End plate
4. Back plate
5. Backing Sheet
6. Carbon rods
7. Attachments: These are the external geometric parts of each sector, used for clamping and mounting each sector. so, they might change with the orientation of each sector
A detailed drawing of this Basic sector assembly can be viewed at File:B00000-01-10-0001.pdf
Nose Plate
Nose plate is the plate where both the end plates are attached to it on either side
A detailed drawing of Nose plate can be viewed at File:B00000-01-10-0002.pdf
Right end plate
Left end plate is the end plate to the left hand side if we are viewing from the target.
They can be referenced with left and right to show each sub assembly.
A detailed drawing of right end plate Core can be viewed at File:B00000-01-10-0003.pdf
A detailed drawing of right end plate skin can be viewed at File:B00000-01-10-0004.pdf
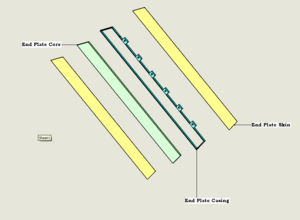
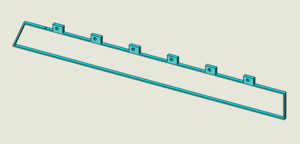
Since end plate casing will not have holes for wires, the drawing for left end plate casing and right end plate casing will be the same.
A detailed drawing of End plate casing can be viewed at File:B00000-01-10-0005.pdf
Left End Plate
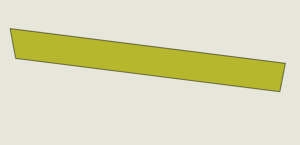
Left end plate is the end plate to the left hand side if we are viewing from the target. Left end plate and the right end plate are same with parts and its dimensions. However, the hole locations differ between each other.
Each end plate sub assembly consists of 3 parts, namely
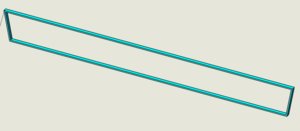
End plate casing - Made of Aluminum.
They can be referenced with left and right to show each sub assembly.
A detailed drawing of Left end plate Core can be viewed at File:B00000-01-10-0006.pdf
A detailed drawing of Left end plate skin can be viewed at File:B00000-01-10-0007.pdf
Back Plate
Back plate is the plate which connects the left end plate and right end plate on the top.
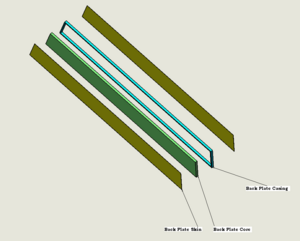
Back plate sub assembly consists of 3 parts, namely
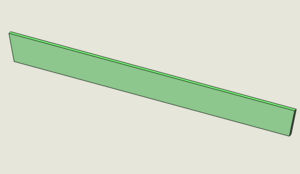
Back plate Core - made of Polyurethane
Back plate Skins - 2 No's- Made of stainless steel
Back plate casing - Made of Aluminum
A detailed drawing of back plate Core can be viewed at File:B00000-01-10-0008.pdf
A detailed drawing of back plate skin can be viewed at File:B00000-01-10-0009.pdf
A detailed drawing of back plate casing can be viewed at File:B00000-01-10-0010.pdf
Backing Sheet
Backing sheet is the large sheet which is mounted on the downstream side of sector.
It consists of 2 parts, namely
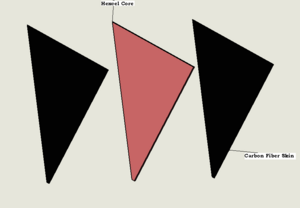
Hexcel Core and Carbon fiber skins on either side
A detailed drawing of back plate Core can be viewed at File:B00000-01-10-0011.pdf
A detailed drawing of back plate skin can be viewed at File:B00000-01-10-0012.pdf
Carbon fiber rods
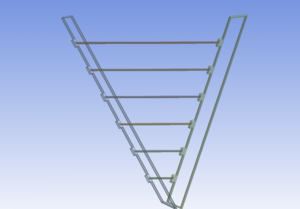
These rods are mounted on the upstream side of each sector, connecting the left end plate aluminum casing and right end plate aluminum casing..
There are 6 Carbon rods each of outer diameter of 50.8 mm and inner diameter of 48.26mm
A detailed drawing of carbon fiber rods can be viewed at File:B00000-01-10-0013.pdf
