Difference between revisions of "QADC spectrum"
(→SETUP) |
|||
| (6 intermediate revisions by the same user not shown) | |||
| Line 1: | Line 1: | ||
=QDC Analysis= | =QDC Analysis= | ||
| − | + | =SETUP= | |
| + | |||
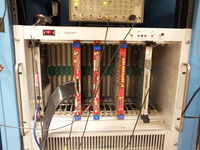
| + | [[File:LDS_VME_QDC.png |200px]] | ||
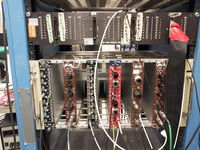
| + | [[File:LDS_electronics_modules_NIMbins.png |200px]] | ||
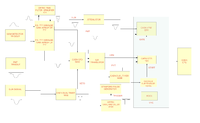
| + | [[File:IAC_electronics_flow_chart.png |200px]] | ||
| + | |||
| + | |||
| + | |||
| − | |||
Main points for data analysis: | Main points for data analysis: | ||
| Line 16: | Line 22: | ||
partially ionized alpha particles or other particles ionization. | partially ionized alpha particles or other particles ionization. | ||
| − | + | * percentage of charge of shutter open - shutter close to shutter open. | |
The table below shows the percentage of the charge of (shutter open - shutter close) to that of shutter open. | The table below shows the percentage of the charge of (shutter open - shutter close) to that of shutter open. | ||
| − | + | ||
| + | details proving signal is from detector ON/OFF | ||
| + | |||
| + | details of measuring shutter OPEN - Closed (why negative counts????) | ||
| + | |||
| + | |||
| + | {| border="1" cellpadding="4" | ||
| + | |- | ||
| + | |voltage (kV) || Charge (shutter open - shutter close)(pC)|| charge (pC) || ratio | ||
| + | |- | ||
| + | | 2.6 || 0.3282 || 5.73 || | ||
| + | |- | ||
| + | | 2.65 || || || | ||
| + | |- | ||
| + | | 2.7 || || || | ||
| + | |- | ||
| + | | 2.75 || || || | ||
| + | |- | ||
| + | | 2.8 || || || | ||
| + | |||
| + | |} | ||
| + | |||
| + | |||
| + | |||
| + | |||
| + | * percentage of charge of shutter open to shutter close. | ||
Latest revision as of 03:09, 23 April 2014
QDC Analysis
SETUP
Main points for data analysis:
- The number of peaks.
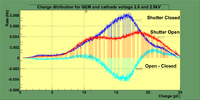
shutter open has two peaks, and shutter close has one peak.
- charge ratio.
shown in the figure below.
- peak shift.
partially ionized alpha particles or other particles ionization.
- percentage of charge of shutter open - shutter close to shutter open.
The table below shows the percentage of the charge of (shutter open - shutter close) to that of shutter open.
details proving signal is from detector ON/OFF
details of measuring shutter OPEN - Closed (why negative counts????)
| voltage (kV) | Charge (shutter open - shutter close)(pC) | charge (pC) | ratio |
| 2.6 | 0.3282 | 5.73 | |
| 2.65 | |||
| 2.7 | |||
| 2.75 | |||
| 2.8 |
- percentage of charge of shutter open to shutter close.
Detector Charge Spectrum
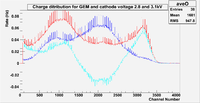
The detector has been tested after installing U-233 and its shutter using CAEN V792 Q-ADC (Analog charge to digital converter). The detector design has been modified by adding U-233 and an FR4 shutter as mentioned in sections xx and yy. To observe a signal for the alpha particles emitted by U-233, an input voltage was 2.6 kV and 2.9 kV for HV-divider circuit and the cathode successively. The output of the trigout goes through the electronic modules then to the DAQ system as mentioned in section x. the following figure show the charge spectrum collected by the DAQ system.
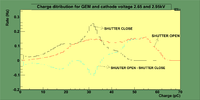
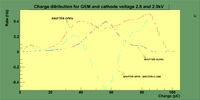
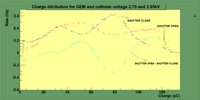
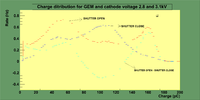
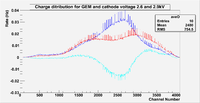
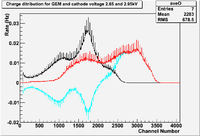
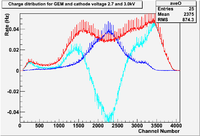
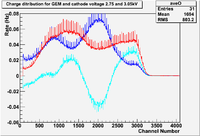
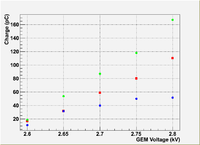
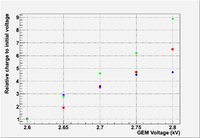
The figure shows the charge spectrum as the shutter is open (red), shutter close (navy), and the difference between them (blue), it also shows that the charge is almost 27% higher as the shutter is close than that of the shutter is close. The same results are observed as the voltage on GEM preamplifiers gradually increases to 2.9 kV by 50V increment as shown in the table below:
A Non-linear increase in the charge collected by the Q-ADC as the voltage increases for GEM HV-circuit, also the figures show the change in the charge spectrum as the shutter position changed, shutter open's charge spectra show more collected charge than that of shutter close.
|
|
First Peak in Shutter open spect
| voltage (kV) | channel number for three runs | charge calibration factor | Charge (nC) | Average Charge from the figure (nC) |
| 2.75 | 1143+_3 ,1274+_3 , 1026+_3 | 0.0393 | 45.11 | 50 |
| 2.80 | 1078+_2, 1015+_2, 1110+_1 | 0.051 | 54.45 | 50 |
The table above shows a comparison between the averaging 3 charge spectra to find the channel number for the first peak as the shutter is open (last column), and a gaussian fitting for each peak for each run separately to find the average, then calculating the average for the three peaks' channel number (column 3). The comparison shows that the first peak is still considered saturated.
GO BACK [1]
