Difference between revisions of "Api PubCLAS2000"
Jump to navigation
Jump to search
(Created page with "=Re-running data analysis= On DAQ1 machine the code is in the subdirectory /home/daq/src/CLAS/eg1_dst/Tamuna The run list is hard coded. Recompile as necessary. source /h…") |
|||
| (4 intermediate revisions by the same user not shown) | |||
| Line 13: | Line 13: | ||
source ~/src/CLAS/setup.csh | source ~/src/CLAS/setup.csh | ||
| + | |||
| + | ==Recreation Figure list== | ||
| + | |||
| + | Analyze data files using dstdump to re-creat the following list of figures | ||
| + | |||
| + | 1.2 | ||
| + | 1.3 | ||
| + | 1.5 | ||
| + | 1.6 | ||
| + | 1.7 | ||
| + | 1.8 | ||
| + | 1.14 | ||
| + | 1.18 | ||
| + | 1.19 | ||
| + | |||
| + | |||
| + | ==Non ROOT analysis Recreation figure list== | ||
| + | |||
| + | 1.10 | ||
| + | 1.12 | ||
=Figures= | =Figures= | ||
| + | ==Figure 1.15== | ||
| + | |||
| + | [[File:Fig1.15_V3.xmgrace.txt]] | ||
| + | |||
| + | ==Figure 1.17== | ||
| + | |||
| + | [[File:Fig1.17_V3.xmgrace.txt]] | ||
| + | |||
| + | |||
| + | ==Figure 2.1== | ||
| + | |||
| + | [[File:Fig2.1_V3.xmgrace.txt]] | ||
| + | |||
| + | ==Figure 2.2== | ||
| + | |||
| + | [[File:Fig2.2_V3.xmgrace.txt]] | ||
| + | |||
==Figure 2.5== | ==Figure 2.5== | ||
| − | [[File:Fig2. | + | [[File:Fig2.5_a_V3.xmgrace.txt]] |
| + | |||
| + | |||
| + | |||
| + | =Additional Figures= | ||
| + | |||
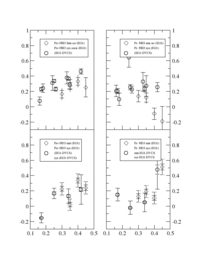
| + | ==Comparison with EG1-DVCS== | ||
| + | |||
| + | [[File:EG2000-EG1DVCS_PiAsym-vs-Xbj.png | 200 px]][[File:EG2000-EG1DVCS_PiAsym-vs-Xbj.xmgrace.txt]] | ||
[[SIDIS_PionAsym_EG2000]] | [[SIDIS_PionAsym_EG2000]] | ||
Latest revision as of 12:41, 25 September 2014
Re-running data analysis
On DAQ1 machine the code is in the subdirectory
/home/daq/src/CLAS/eg1_dst/Tamuna
The run list is hard coded. Recompile as necessary.
source /home/daq/ROOT/root/bin/thisroot.csh
source ~/src/CLAS/setup.csh
Recreation Figure list
Analyze data files using dstdump to re-creat the following list of figures
1.2 1.3 1.5 1.6 1.7 1.8 1.14 1.18 1.19
Non ROOT analysis Recreation figure list
1.10 1.12
Figures
Figure 1.15
Figure 1.17
Figure 2.1
Figure 2.2
Figure 2.5
