Difference between revisions of "Sadiq Thesis"
| (108 intermediate revisions by 2 users not shown) | |||
| Line 1: | Line 1: | ||
= Introduction = | = Introduction = | ||
| − | |||
| − | Positron | + | == Positron Beam == |
| − | Positrons | + | Positrons have many potentials in many discipline of science, like chemistry, physics, material science, surface science, biology and nanoscience <ref name="Chemerisov2009JLabConf"> Chemerisov, S. and Jonah, Charles D., "{Generation of high intensity thermal positron beams using a 20-MeV electron linac}", "AIP Conf.Proc.", "1160", "87-93", "10.1063/1.3232039", "2009" </ref>. There are many different ways to generate positrons, and the main challenge is increasing the intensity (or current) of the positron beam. |
| + | == Motivation == | ||
| − | |||
| − | == | + | The nucleon electromagnetic form factors are fundamental quantities that can be physically interpreted as the charge and magnetic moment of a nucleon in the Beit reference frame where the probe appears to bounce off a target that does not recoil. |
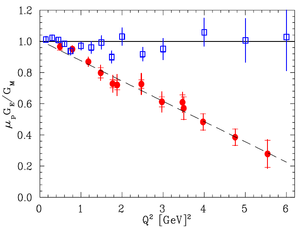
| + | Conventionally, the nucleon form factors are measured using the Rosenbluth Technique (RT) <ref name="Rosenbluth1950"> M. N. Rosenbluth, Phys. Rev. 79, 615(1950). </ref>. The form factor scaling ratio,<math>R=\mu _p G_{Ep} / G_{Mp}</math>, measured using this technique is around unity as shown in the figure below <ref name="Walker1994"> R. C. Walker et al., Phys. Rev. D 49, 5671(1994). </ref>. | ||
| + | Since the 1990s, a technique using elastic electron-proton polarization transfer has been developed to measurement this ratio<ref name="Walker1994"> </ref>, <ref name="Arrington2003"> J. Arrington, Phys. Rev. C 68, 034325 (2003). </ref>, <ref name="Walker1989"> R. C. Walker, Ph.D. thesis, California Institute of Technology(1989). </ref>. In this technique, the form factor ratio linearly decreases as the <math>Q^2</math> increases, as shown in the figure below. | ||
| + | |||
| + | {| border="1" cellpadding="4" | ||
| + | |- | ||
| + | | [[File:sadiq_thesis_mot_RT_RPT_1.png | 300 px |thumb| FIG. Form factor ratio, obtained by Rosenbluth Technique (hollow square) and results from Recoil Polarization Technique <ref name="Arrington2003">J. Arrington, Phys. Rev. C 68, (2003) 034325 and arXiv:nucl-ex/0305009. </ref>. | ||
| + | ]] | ||
| + | |} | ||
| + | |||
| + | The figure shows that the two techniques disagree at higher value of Q^2. One proposed reason for this disagreement lies with the Rosenbluth Techqniue's assumption that only one virtual photon is exchanged during the scattering (OPE). Two photon exchange (TPE),depends weakly on <math>Q^2</math> but may become considerable with increasing <math>Q^2</math> and explain the discrepancy <ref name="Arrington2003"></ref>. The contribution of TPE can be obtained by comparing the ratio of <math>e^+~p</math> to <math>e^-~p</math> ratio. The interference of OPE and TPE can also be studied in the process <math>e^+e^- \rightarrow p\bar p</math> | ||
| + | |||
| + | why can positron source determine if two photons are exchanged | ||
=Theory= | =Theory= | ||
| Line 22: | Line 33: | ||
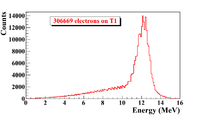
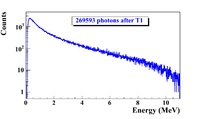
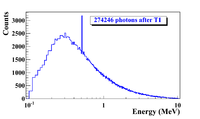
When a moving charge particle interacts with the electric field of another charged particle, it can be deflected and releases lost energy in the form of photons. This is known as the Bremsstrahlung process. The probability of this interaction increases with the atomic number of the material traversed by the incident charged particle. Figure~\ref{fig"Brem}c show the photon energy distribution when a 12 MeV electron distribution from Figure~\ref{fig"Brem}b interacts with a 1 mm thick Tungsten target. The number of photons in this example produced decreases as the energy of the produced photon increases. The Bremsstrahlung photons are also likely to interact with the material. | When a moving charge particle interacts with the electric field of another charged particle, it can be deflected and releases lost energy in the form of photons. This is known as the Bremsstrahlung process. The probability of this interaction increases with the atomic number of the material traversed by the incident charged particle. Figure~\ref{fig"Brem}c show the photon energy distribution when a 12 MeV electron distribution from Figure~\ref{fig"Brem}b interacts with a 1 mm thick Tungsten target. The number of photons in this example produced decreases as the energy of the produced photon increases. The Bremsstrahlung photons are also likely to interact with the material. | ||
| − | + | ||
{| border="1" cellpadding="4" | {| border="1" cellpadding="4" | ||
| Line 40: | Line 51: | ||
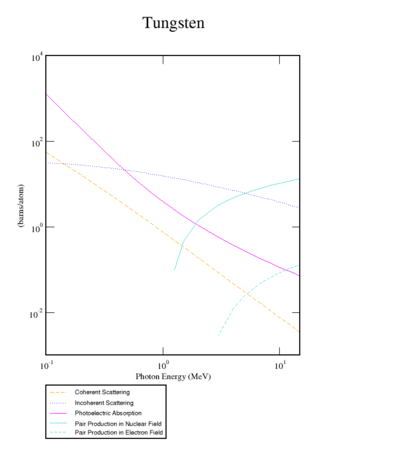
Insert plot of XCOM Tungsten cross sections showing for each process over the incident photon range available for this experiment. | Insert plot of XCOM Tungsten cross sections showing for each process over the incident photon range available for this experiment. | ||
| − | + | {| border="1" cellpadding="4" | |
| + | |- | ||
| + | |[[ File:sadiq_thesis_3pro-in-W.png | 400 px |thumb| Cross section of processes that photons interacts with tungsten. ]] | ||
| + | |} | ||
| + | |||
| + | http://physics.nist.gov/cgi-bin/Xcom/xcom2 | ||
| + | |||
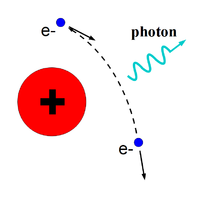
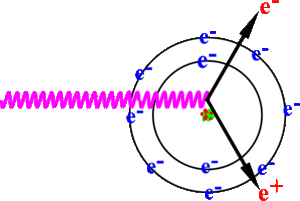
The positron and electron pairs are created back to back in the center of mass frame. In the lab frame, electrons and positrons are boosted forward, as shown in Figure~\ref{fig:annihil}. The positron and electron carry away the energy from the photon that is in excess of 1.022 MeV.In the center of mass frame, the kinetic energy is equally shared. Photons with an energy above 1.022 MeV in the bremsstrahlung spectrum of Figure ~\ref{fig:Brem} have the potential to create electron and positron pairs. When the process of annihilation is included in the simulation, Figure~\ref{fig:brem} becomes Figure~\ref{fig:annih} showing a clear 511 keV peak on top of the bremsstrahlung spectrum. This 511 keV peak represents photon produced when the created positrons, from pair production, annihilates with an atomic electrons inside the tungsten target. | The positron and electron pairs are created back to back in the center of mass frame. In the lab frame, electrons and positrons are boosted forward, as shown in Figure~\ref{fig:annihil}. The positron and electron carry away the energy from the photon that is in excess of 1.022 MeV.In the center of mass frame, the kinetic energy is equally shared. Photons with an energy above 1.022 MeV in the bremsstrahlung spectrum of Figure ~\ref{fig:Brem} have the potential to create electron and positron pairs. When the process of annihilation is included in the simulation, Figure~\ref{fig:brem} becomes Figure~\ref{fig:annih} showing a clear 511 keV peak on top of the bremsstrahlung spectrum. This 511 keV peak represents photon produced when the created positrons, from pair production, annihilates with an atomic electrons inside the tungsten target. | ||
| Line 46: | Line 63: | ||
{| border="1" cellpadding="4" | {| border="1" cellpadding="4" | ||
|- | |- | ||
| − | + | |[[ File:sadiq_thesis_PairPro.png |thumb| Pair production. ]] || [[ File:sadiq_thesis_Brems_photon_Ene_log.png | 200 px |thumb| Simulated Bremsstrahlung photon energy right after a tungsten foil. ]] | |
|} | |} | ||
| Line 58: | Line 75: | ||
==Positron rate prediction== | ==Positron rate prediction== | ||
| − | |||
| − | |||
| − | |||
| − | |||
| − | |||
| − | |||
| − | |||
| − | |||
| − | |||
| − | |||
| − | |||
| − | |||
| − | |||
| − | |||
| − | |||
| − | |||
| − | |||
| − | |||
| − | |||
| − | |||
| − | |||
| − | |||
| − | |||
| − | |||
| − | |||
| − | |||
| − | |||
| − | |||
| − | |||
| − | |||
| − | |||
| − | |||
| − | |||
| − | |||
| − | |||
| − | |||
| − | |||
| − | |||
| − | |||
| − | |||
Positron production target is tungsten foil with 1.25 inch (31.75 mm) diameter, 0.04 inch (1.016 mm) thickness, and placed with 45 degree angle leaning forward as shown in figure. Two virtual detectors with 25.4 mm radius located 26.52 mm away from the center of the T1. | Positron production target is tungsten foil with 1.25 inch (31.75 mm) diameter, 0.04 inch (1.016 mm) thickness, and placed with 45 degree angle leaning forward as shown in figure. Two virtual detectors with 25.4 mm radius located 26.52 mm away from the center of the T1. | ||
| Line 123: | Line 100: | ||
|} | |} | ||
| − | + | =Apparatus= | |
| − | + | == HRRL Beamline == | |
| − | + | https://wiki.iac.isu.edu/index.php/Beamline_Drawing_2011_J.Ellis | |
The HRRL (High Repetition Rate Linac) ia a 16~MeV S-band linac located at the Beam Lab of the Department of the Physics, Idaho State University. The HRRL linac structure was upgraded beyond the capabilities of a typical medical linac so it can achieve a repetition rate of 1~kHz. | The HRRL (High Repetition Rate Linac) ia a 16~MeV S-band linac located at the Beam Lab of the Department of the Physics, Idaho State University. The HRRL linac structure was upgraded beyond the capabilities of a typical medical linac so it can achieve a repetition rate of 1~kHz. | ||
| Line 145: | Line 122: | ||
|- | |- | ||
| macro pulse length|| ns || >50 | | macro pulse length|| ns || >50 | ||
| + | |} | ||
| + | |||
| + | |||
| + | |||
| + | HRRL beamline layout is given in the figure below, and the item descriptions are given in the table below. | ||
| + | |||
| + | {| border="1" cellpadding="4" | ||
| + | |- | ||
| + | |[[File:HRRL_beamline.png | 600 px |thumb|HRRL beamline layout. ]] | ||
| + | |} | ||
| + | |||
| + | |||
| + | {| border="3" cellpadding="5" cellspacing="0" | ||
| + | | Label || Beamline Element | ||
| + | |- | ||
| + | | T1 || positron target | ||
| + | |- | ||
| + | | T2 || annihilation target | ||
| + | |- | ||
| + | | EnS || energy slit | ||
| + | |- | ||
| + | | FC1, FC2 || Faraday cups | ||
| + | |- | ||
| + | | Q1,...Q10|| quadrupoles | ||
| + | |- | ||
| + | | D1, D2 || dipoles | ||
| + | |- | ||
| + | | NaI || NaI detecotrs | ||
| + | |- | ||
| + | | OTR || optical transition radiation screen | ||
| + | |- | ||
| + | | YAG || yttrium aluminium garnet screen | ||
| + | |} | ||
| + | |||
| + | |||
| + | {| border="1" cellpadding="4" | ||
| + | |- | ||
| + | |[[File:sadiq_thesis_HRRL_sim_setup_T1_UpD_DwD2.png | 400 px |thumb|T1: Positron production target; DUPT1: upstream detector; DDNT1: down stream (DDNT1); DT1: detector right after T1. ]] | ||
|} | |} | ||
| Line 298: | Line 313: | ||
Digital images from the JAI camera were extracted in a matrix format in order to take projections on both axes and perform a Gaussian fit. The observed image profiles were not well described by a single Gaussian distribution. The profiles may be described using a Lorentzian distribution, however, the rms of the Lorentzian function is not defined. The super Gaussian distribution seems to be the best option~<ref name="sup-Gau"> F.J. Decker, SLAC-PUB-6684, Sep, 1994. </ref>, because rms values may be directly extracted. | Digital images from the JAI camera were extracted in a matrix format in order to take projections on both axes and perform a Gaussian fit. The observed image profiles were not well described by a single Gaussian distribution. The profiles may be described using a Lorentzian distribution, however, the rms of the Lorentzian function is not defined. The super Gaussian distribution seems to be the best option~<ref name="sup-Gau"> F.J. Decker, SLAC-PUB-6684, Sep, 1994. </ref>, because rms values may be directly extracted. | ||
| − | Fig.~\ref{par-fit} shows the square of the rms (<math>\sigma^2_{s}</math>) ''vs'' ''k_1L'' for ''x'' (horizontal) and ''y'' (vertical) beam projections along with the parabolic fits using Eq.~\ref{par_fit}. The emittances and Twiss parameters from these fits are summarized in Table~\ref{results}. | + | Fig.~\ref{par-fit} shows the square of the rms (<math>\sigma^2_{s}</math>) ''vs'' ''k_1L'' for ''x'' (horizontal) and ''y'' (vertical) beam projections along with the parabolic fits using Eq.~\ref{par_fit}. The emittances and Twiss parameters from these fits are summarized in Table~\ref{results}. |
| + | |||
| − | |||
| Line 396: | Line 411: | ||
=Data Analysis= | =Data Analysis= | ||
| + | |||
| + | [[Back of the envelope calculation for e+/e- ratio]] | ||
| + | |||
==Signal extraction== | ==Signal extraction== | ||
| Line 603: | Line 621: | ||
===acceptance, quad collection efficiency, === | ===acceptance, quad collection efficiency, === | ||
| + | |||
| + | |||
| + | = Simulation = | ||
| + | |||
| + | [[July2012PosSimulation]] | ||
| + | |||
| + | A simulation was performed using the package G4beamline(ref Muons inc) to study the processes of position generation and transportation. "G4beamline is a particle tracking and simulation program based on the Geant4 (refernce G4) toolkit that is specifically designed to easily simulate beamlines and other systems using single-particle tracking." Since the ratio of e+/e- during the positron generation process is very low (on the order of 0.001) and the positron beam loss during the transportation is large, it was necessary to divide whole process into 5 steps. A new beam event generator is created based on the results of the previous step in the simulation. | ||
| + | |||
| + | The first step generates electrons according to a measurement made of the accelerator that was used in the experiment. Electrons are transported to T1 in vacuum and as a result the interactions of the electron with T1 produce positrons. The second step is the transportation of the positrons generated at T1 to the entrance of first dipole magnet. The third step is the transportation of the positrons from the entrance of the first dipole magnet to the end of the second dipole. The fourth step is the transportation of the beam from the exit of the second dipole to the T2 target. The fifth step is the positron beam interaction with T2 and detection of the resulting 511 keV photons. | ||
| + | |||
| + | == Step 1 - The Electron Beam Generation and Transpiration to T1 == | ||
| + | |||
| + | In this step, an electron beam is generated from the experimental measure electron beam parameters. The Twis parameters described in the earlier chapter used electron generated the beam. The energy distribution is of the beam is measured and shown in the Fig.~\ref{fig:sim-ele-En}. The blue dots are measurements and red line are the fit composed of two skewed Gaussian distributions. The fit parameters are given in the Table~\ref{tab:sim-skew-Gau} | ||
| + | |||
| + | |||
| + | [[File:hrrl_17May2012_12MeV_En_Spread2.png | 400 px]] | ||
| + | |||
| + | |||
| + | {| border="3" cellpadding="5" cellspacing="0" | ||
| + | | || Amplitude || Mean (MeV) || <math>\sigma _L</math> ||<math>\sigma _R</math> | ||
| + | |- | ||
| + | | First Gaussian || 2.14 || 12.07 || 4.47 || 1.20 | ||
| + | |- | ||
| + | | Second Gaussian || 10.88 || 12.32 || 0.70 || 0.45 | ||
| + | |||
| + | |} | ||
| + | |||
| + | Series of virtual detectors are placed along the beamline to sample the beam. As an example, in the Fig.~\ref{fig:sim-T1-3det} shown are three detectors and the T1. The electron beam is observed at DUPT1 (Detector 25.52 mm UPstram of T1) and positrons (or electrons and photons) generated during the interaction of electron beam with T1 are observed at DT1 (Detector of T1) and DDNT1 (Detector DowN 25.52 mm stream of T1). In the Fig.~\ref{fig:sim-ele-pos}, the incoming electron beam (observed at DUPT1) energy distribution (red) and positrons generated by this electron beam (observed at DDNT1) is shown in blue. | ||
| + | |||
| + | {| border="1" cellpadding="4" | ||
| + | |- | ||
| + | |[[File:sadiq_thesis_HRRL_sim_setup_T1_UpD_DwD2.png | 400 px |thumb|T1: Positron production target; DUPT1: upstream detector; DDNT1: down stream (DDNT1); DT1: detector right after T1. ]] | ||
| + | |} | ||
| + | |||
| + | |||
| + | === Results === | ||
| + | |||
| + | ====DDNT1==== | ||
| + | |||
| + | 13,799,743,900 electrons were shot on T1 and resulted positron beam observed at DDNT1 is as shown below Figures. | ||
| + | |||
| + | [[File:STSimS1_En_DDNT1_e+.png | 400 px]] | ||
| + | |||
| + | [[File:STSimS1_X_DDNT1.png | 400 px]] | ||
| + | |||
| + | [[File:STSimS1_Y_DDNT1.png | 400 px]] | ||
| + | |||
| + | [[File:STSimS1_XP_DDNT1.png | 400 px]] | ||
| + | |||
| + | [[File:STSimS1_YP_DDNT1.png | 400 px]] | ||
| + | |||
| + | [[File:STSimS1_XY_DDNT1.png | 400 px]] | ||
| + | |||
| + | [[File:STSimS1_XY_DDNT1_zoom.png | 400 px]] | ||
| + | |||
| + | The Y-position distribution of the beam shown in Figure ~\ref{sim-DDNT1-y-vs-x} has a sharp drop in the region between -25.8 mm and -27.2 mm that corresponds to the boundary of the target T1. Figure ~\ref{sim-DDNT1-T1-geo} shows the geometry of the target T1 and the sensitive detector DDNT1. If the target size was increased, it would eventually intersected the detector DDNT1 at a distance of 25.8 mm from the beam center. A 1.4 mm wide stripe of low counts is visible on DDNT1 that is a result of the target's thickness of 1.016 mm and the 45 degree angle of intersection. (<math>1.016 \sqrt{2}=1.44</math>). The edge of the target does not produce many positrons compared to the face of the target, and as a result you see the stripe. | ||
| + | |||
| + | As shown in figures ~\ref{sim-DDNT1-theta-vs-y} and ~\ref{sim-DDNT1-theta-vs-y-zoom} (zoomed figure) the positron distribution decrease occures at <math>\theta = 45^o</math>. Positrons are emitted from both the downstream and upstream side of the target. As shown in the figure, positrons from the downstream side of the target intersect the detector at angles below 45 degrees while positrons from the upstream side of the target begin to hit the detector at angles beyond 45 degrees. The 1.4 mm gap represents the transition of positrons between these two extremes. | ||
| + | |||
| + | |||
| + | [[File:hrrl_pos_sim_pos_sharp_drop_geometry2.png | 400 px]] | ||
| + | |||
| + | |||
| + | [[File:STSimS1_YYP_DDNT1.png | 400 px]] | ||
| + | |||
| + | [[File:STSimS1_YYP_DDNT1_zoom.png | 400 px]] | ||
| + | |||
| + | ====DQ4 and DD1==== | ||
| + | |||
| + | Resulted positron beam on DQ1 and DD1 are shown in below Figures. | ||
| + | |||
| + | [[File:STSimS1_En_DQ4_e+.png | 400 px]] | ||
| + | |||
| + | [[File:STSimS1_En_DD1_e+.png | 400 px]] | ||
| + | |||
| + | == Step 2 - Transportation of the The Positron Beam after T1 to The Entrance of The First Dipole== | ||
| + | In this step, the positrons generated in the first step divided into 1~keV/c momentum bins and each bin is sampled individually since the momentum of the positrons related to their divergence. Multiple beams with individual weights generated at downstream T1 detector DDNT1 and transported to entrance of the D1. Virtual detectors are placed at the entrance of Q4 and entrance of D1 to track positrons and generate beam for next step as shown in the Fig~\ref{fig:Sim-s1-setup}. | ||
| + | |||
| + | [[File:STSimSetupS2.png | 400 px]] | ||
=Conclusion= | =Conclusion= | ||
Latest revision as of 16:24, 7 May 2013
Introduction
Positron Beam
Positrons have many potentials in many discipline of science, like chemistry, physics, material science, surface science, biology and nanoscience <ref name="Chemerisov2009JLabConf"> Chemerisov, S. and Jonah, Charles D., "{Generation of high intensity thermal positron beams using a 20-MeV electron linac}", "AIP Conf.Proc.", "1160", "87-93", "10.1063/1.3232039", "2009" </ref>. There are many different ways to generate positrons, and the main challenge is increasing the intensity (or current) of the positron beam.
Motivation
The nucleon electromagnetic form factors are fundamental quantities that can be physically interpreted as the charge and magnetic moment of a nucleon in the Beit reference frame where the probe appears to bounce off a target that does not recoil. Conventionally, the nucleon form factors are measured using the Rosenbluth Technique (RT) <ref name="Rosenbluth1950"> M. N. Rosenbluth, Phys. Rev. 79, 615(1950). </ref>. The form factor scaling ratio,, measured using this technique is around unity as shown in the figure below <ref name="Walker1994"> R. C. Walker et al., Phys. Rev. D 49, 5671(1994). </ref>. Since the 1990s, a technique using elastic electron-proton polarization transfer has been developed to measurement this ratio<ref name="Walker1994"> </ref>, <ref name="Arrington2003"> J. Arrington, Phys. Rev. C 68, 034325 (2003). </ref>, <ref name="Walker1989"> R. C. Walker, Ph.D. thesis, California Institute of Technology(1989). </ref>. In this technique, the form factor ratio linearly decreases as the increases, as shown in the figure below.
The figure shows that the two techniques disagree at higher value of Q^2. One proposed reason for this disagreement lies with the Rosenbluth Techqniue's assumption that only one virtual photon is exchanged during the scattering (OPE). Two photon exchange (TPE),depends weakly on but may become considerable with increasing and explain the discrepancy <ref name="Arrington2003"></ref>. The contribution of TPE can be obtained by comparing the ratio of to ratio. The interference of OPE and TPE can also be studied in the process
why can positron source determine if two photons are exchanged
Theory
Positron creation from Bremsstrahlung
When a moving charge particle interacts with the electric field of another charged particle, it can be deflected and releases lost energy in the form of photons. This is known as the Bremsstrahlung process. The probability of this interaction increases with the atomic number of the material traversed by the incident charged particle. Figure~\ref{fig"Brem}c show the photon energy distribution when a 12 MeV electron distribution from Figure~\ref{fig"Brem}b interacts with a 1 mm thick Tungsten target. The number of photons in this example produced decreases as the energy of the produced photon increases. The Bremsstrahlung photons are also likely to interact with the material.
There are three competing processes that a photon can undergo when interacting with matter. At electron volt (eV) energies comparable to the electron atomic binding energy, the dominant photon interaction is via photoelectric effect. As the photon energy increases up to kilo-electron volt (keV) range, the Compton scattering process starts to be more dominant. Although the photon is totally absorbed during the photoelectric effect, photons merely lose energy when undergoing Compton scattering. As the photon energy reaches twice the rest mass energy of electron, 2 511 keV, pair production begins to happen. Pair production becomes dominant interaction process only for energies above 5 MeV <ref name="Krane"> Introductory Nuclear Physics, K. S. Krane, JOHN WILEY & SONS,1988;</ref>. In this process, a photon interacts with the electric field of the nucleus or the bound electrons and decays into an electron and positron pair.
Insert plot of XCOM Tungsten cross sections showing for each process over the incident photon range available for this experiment.
http://physics.nist.gov/cgi-bin/Xcom/xcom2
The positron and electron pairs are created back to back in the center of mass frame. In the lab frame, electrons and positrons are boosted forward, as shown in Figure~\ref{fig:annihil}. The positron and electron carry away the energy from the photon that is in excess of 1.022 MeV.In the center of mass frame, the kinetic energy is equally shared. Photons with an energy above 1.022 MeV in the bremsstrahlung spectrum of Figure ~\ref{fig:Brem} have the potential to create electron and positron pairs. When the process of annihilation is included in the simulation, Figure~\ref{fig:brem} becomes Figure~\ref{fig:annih} showing a clear 511 keV peak on top of the bremsstrahlung spectrum. This 511 keV peak represents photon produced when the created positrons, from pair production, annihilates with an atomic electrons inside the tungsten target.
Insert a plot of the brehmsstralung photon energy from 12 MeV electron on Tungsten and point out how positrons are generated from this distribution.
What fraction of photons are above 1.022 MeV compared to below.
Positron rate prediction
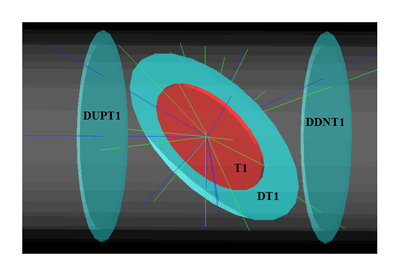
Positron production target is tungsten foil with 1.25 inch (31.75 mm) diameter, 0.04 inch (1.016 mm) thickness, and placed with 45 degree angle leaning forward as shown in figure. Two virtual detectors with 25.4 mm radius located 26.52 mm away from the center of the T1.
Simulation Result
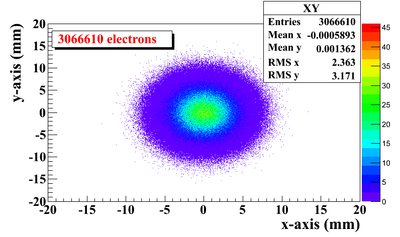
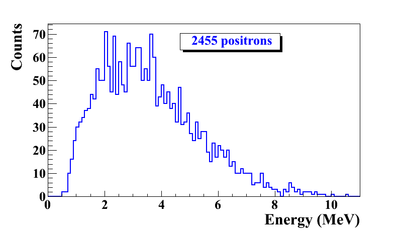
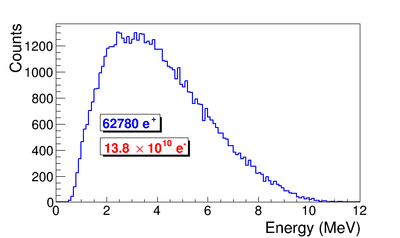
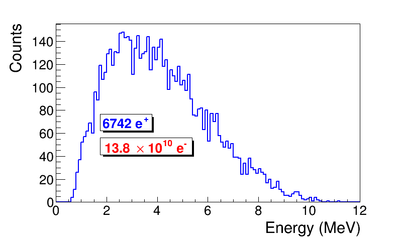
G4beamline simulation of the experiment using electron beam: 3160571 electrons on T1 is given in red. 2385 positrons escaped downstream of T1 is given in blue.
Apparatus
HRRL Beamline
https://wiki.iac.isu.edu/index.php/Beamline_Drawing_2011_J.Ellis
The HRRL (High Repetition Rate Linac) ia a 16~MeV S-band linac located at the Beam Lab of the Department of the Physics, Idaho State University. The HRRL linac structure was upgraded beyond the capabilities of a typical medical linac so it can achieve a repetition rate of 1~kHz.
Some parameters of the HRRL is given by:
| Parameter | Unit | Value |
| maximum energy | MeV | 16 |
| peak current | mA | 100 |
| repetition rate | Hz | 300 |
| absolute energy spread | MeV | 2-4 |
| macro pulse length | ns | >50 |
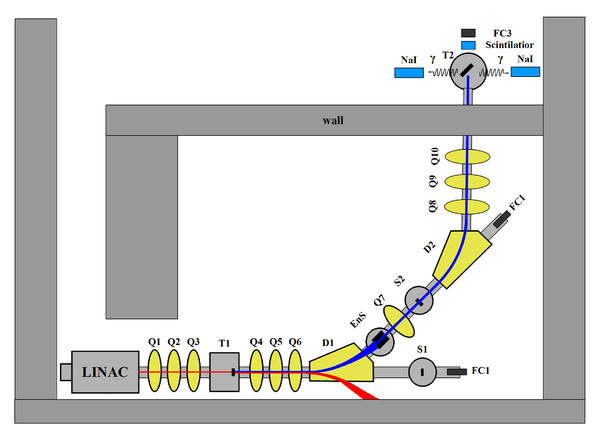
HRRL beamline layout is given in the figure below, and the item descriptions are given in the table below.
| Label | Beamline Element |
| T1 | positron target |
| T2 | annihilation target |
| EnS | energy slit |
| FC1, FC2 | Faraday cups |
| Q1,...Q10 | quadrupoles |
| D1, D2 | dipoles |
| NaI | NaI detecotrs |
| OTR | optical transition radiation screen |
| YAG | yttrium aluminium garnet screen |
Beam properties
Emittance Measurement
Emittance is an important parameter in accelerator physics. If emittance with twiss parameters are given at the exit of the gun, we will be able to calculate beam size and divergence any point after the exit of the gun. Knowing the beam size and beam divergence on the positron target will greatly help us study the process of creating positron. Emittance with twiss parameters are also key parameters for any accelerator simulations. Also, energy and energy spread of the beam will be measured in the emittance measurement.
What is Emittance
In accelerator physics, Cartesian coordinate system was used to describe motion of the accelerated particles. Usually the z-axis of Cartesian coordinate system is set to be along the electron beam line as longitudinal beam direction. X-axis is set to be horizontal and perpendicular to the longitudinal direction, as one of the transverse beam direction. Y-axis is set to be vertical and perpendicular to the longitudinal direction, as another transverse beam direction.
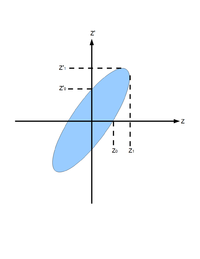
For the convenience of representation, we use to represent our transverse coordinates, while discussing emittance. And we would like to express longitudinal beam direction with . Our transverse beam profile changes along the beam line, it makes is function of , . The angle of a accelerated charge regarding the designed orbit can be defined as:
If we plot vs. , we will get an ellipse. The area of the ellipse is an invariant, which is called Courant-Snyder invariant. The transverse emittance of the beam is defined to be the area of the ellipse, which contains 90% of the particles <ref name="MConte08"> M. Conte and W. W. MacKay, “An Introduction To The Physics Of Particle Accelera tors”, World Scientifc, Singapore, 2008, 2nd Edition, pp. 257-330. </ref>.
By changing quadrupole magnetic field strength , we can change beam sizes on the screen. We make projection to the x, y axes, then fit them with Gaussian fittings to extract rms beam sizes, then plot vs vs . By Fitting a parabola we can find constants ,, and , and get emittances.
Emittance Measurements with an OTR
A beam emittance measurement of the HRRL was performed at Idaho State University's IAC with YAG (Yttrium Aluminium Garnet) was performed. Due to the high sensitivity of YAG, the beam image was saturated and beam spot pears rather big. Comparison study shows that for same beam YAG screen shows bigger beam size than Optical Transition Radiation (OTR) screen. An OTR based viewer was installed to allow measurements at the high electron currents available using the HRRL.
The OTR screen is 10 thick aluminium. Beam images were taken with digital CCD camera, a MATLAB tool were used to extract beamsize and emittance.
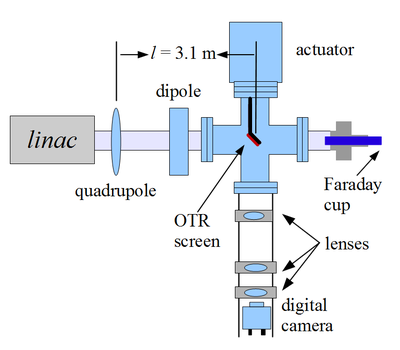
The visible light from the OTR based viewer is produced when a relativistic electron beam crosses the boundary of two mediums with different dielectric constants. Visible radiation is emitted at an angle of 90 degree with respect to the incident beam direction<ref name="OTR"> Tech. Rep., B. Gitter, Los Angeles, USA (1992). </ref> when the electron beam intersects the OTR target at a 45 degree angle. These backward-emitted photons are observed using a digital camera and can be used to measure the shape and intensity of the electron beam based on the OTR distribution.
Quadrupole Scanning Method
Fig. on the right illustrates the apparatus used to measure the emittance using the quadrupole scanning method. A quadrupole is positioned at the exit of the linac to focus or de-focus the beam as observed on a downstream view screen. The 3.1 m distance between the quadrupole and the screen was chosen in order to minimize chromatic effects and to satisfy the thin lens approximation.
Assuming the thin lens approximation, , is satisfied, the transfer matrix of a quadrupole magnet may be expressed as
where is the quadrupole strength, is the length of quadrupole, and is the focal length. A matrix representing the drift space between the quadrupole and screen is given by
where is the distance between the scanning quadrupole and the screen. The transfer matrix of the scanning region is given by the matrix product . In the horizontal plane, the beam matrix at the screen () is related to the beam matrix of the quadrupole () using the similarity transformation
where the and are defined as <ref name="SYLee"> Accelerator Physics, S.Y. Lee, (Singapore: World Scientific, 2004), 61. </ref>
By defining the new parameters <ref name="quad-scan"> D.F.G. Benedetti, et al., Tech. Rep., DAFNE Tech. Not., Frascati, Italy (2005). </ref>,
the matrix element , the square of the rms beam size at the screen, may be expressed as a parabolic function of the product of and
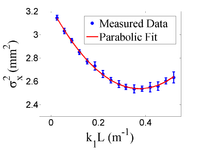
The emittance measurement was performed by changing the quadrupole current, which changes , and measuring the corresponding beam image on the view screen. The measured two-dimensional beam image was projected along the image's abscissa and ordinate axes. A Gaussian fitting function is used on each projection to determine the rms value, in Eq.~(\ref{par_fit}). Measurements of for several quadrupole currents () is then fit using the parabolic function in Eq.~(\ref{par_fit}) to determine the constants , , and . The emittance () and the Twiss parameters ( and ) can be found using Eq.~(\ref{emit-relation}).
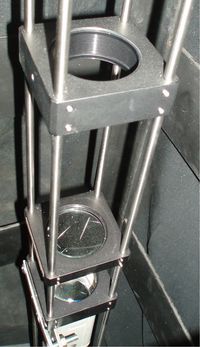
The OTR Imaging System
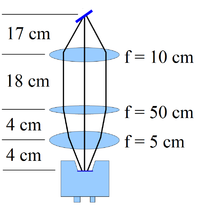
The OTR target is 10 m thick aluminum foil with a 1.25 inch diameter. The OTR is emitted in a cone shape with the maximum intensity at an angle of with respect to the reflecting angle of the electron beam<ref name="OTR"></ref>. Three lenses, 2 inches in diameter, are used for the imaging system to avoid optical distortion at lower electron energies. The focal lengths and position of the lenses are shown in Fig. on the right. The camera used was a JAI CV-A10GE digital camera with a 767 by 576 pixel area. The camera images were taken by triggering the camera synchronously with the electron gun.
Quadrupole Scanning
The quadrupole current is changed to alter the strength and direction of the quadrupole magnetic field such that a measurable change in the beam shape is seen by the OTR system. Initially, the beam was steered by the quadrupole indicating that the beam was not entering along the quadrupole's central axis. Several magnetic elements upstream of this quadrupole were adjusted to align the incident electron beam with the quadrupole's central axis. First, the beam current observed by a Faraday cup located at the end of beam line was maximized using upstream steering coils within the linac nearest the gun. Second, the first solenoid nearest the linac gun was used to focus the electron beam on the OTR screen. Steering coils were adjusted to maximize the beam current to the Faraday cup and minimize the deflection of the beam by the solenoid first then by the quadrupole. A second solenoid and the last steering magnet, both near the exit of the linac, were used in the final step to optimize the beam spot size on the OTR target and maximize the Faraday cup current. A configuration was found that minimized the electron beam deflection when the quadrupole current was altered during the emittance measurements.
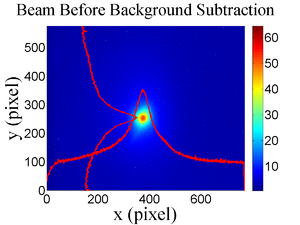
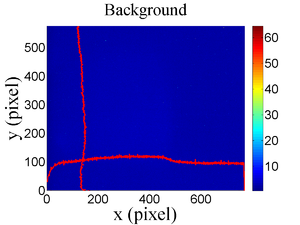
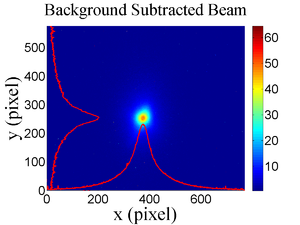
The emittance measurement was performed using an electron beam energy of 15~MeV and a 200~ns long, 40~mA, macro pulse peak current. The current in the first quadrupole after the exit of the linac was changed from $-$~5~A to 5~A with an increment of 0.2~A. Seven measurements were taken at each current step in order to determine the average beam width and the variance. Background measurements were taken by turning the linac's electron gun off while keep the RF on. Background image and beam images before and after background subtraction are shown in Fig.~\ref{bg}. A small dark current is visible in Fig.~\ref{bg}b that is known to be generated when electrons are pulled off the cavity wall and accelerated.
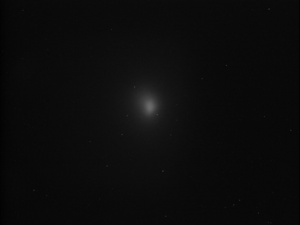
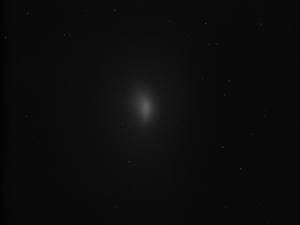
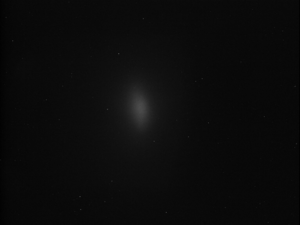
In Fig. below, the images of the electron shown for 0, +1 and +2 Q1 coildcurrents.
The electron beam energy was measured using a dipole magnet downstream of the quadrupole used for the emittance measurements. Prior to energizing the dipole, the electron micro-pulse bunch charge passing through the dipole was measured using a Faraday cup located approximately 50~cm downstream of the OTR screen. The dipole current was adjusted until a maximum beam current was observed on another Faraday cup located just after the 45 degree exit port of the dipole. A magnetic field map of the dipole suggests that the electron beam energy was 15~~1.6~MeV. Future emittance measurements are planned to cover the entire energy range of the linac.
Data Analysis and Results
Images from the JAI camera were calibrated using the OTR target frame. An LED was used to illuminate the OTR aluminum frame that has a known inner diameter of 31.75~mm. Image processing software was used to inscribe a circle on the image to measure the circular OTR inner frame in units of pixels. The scaling factor can be obtained by dividing this length with the number of pixels observed. The result is a horizontal scaling factor of 0.04327~~0.00016~mm/pixel and vertical scaling factor of 0.04204~~0.00018~mm/pixel. Digital images from the JAI camera were extracted in a matrix format in order to take projections on both axes and perform a Gaussian fit. The observed image profiles were not well described by a single Gaussian distribution. The profiles may be described using a Lorentzian distribution, however, the rms of the Lorentzian function is not defined. The super Gaussian distribution seems to be the best option~<ref name="sup-Gau"> F.J. Decker, SLAC-PUB-6684, Sep, 1994. </ref>, because rms values may be directly extracted.
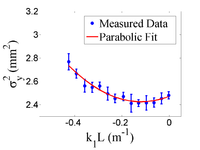
Fig.~\ref{par-fit} shows the square of the rms () vs k_1L for x (horizontal) and y (vertical) beam projections along with the parabolic fits using Eq.~\ref{par_fit}. The emittances and Twiss parameters from these fits are summarized in Table~\ref{results}.
| Parameter | Unit | Value | |
| projected emittance | m | 0.37 0.02 | |
| projected emittance | m | 0.30 0.04 | |
| -function | m | 1.40 0.06 | |
| -function | m | 1.17 0.13 | |
| -function | rad | 0.97 0.06 | |
| -function | rad | 0.24 0.07 | |
| micro-pulse charge | pC | 11 | |
| micro-pulse length | ps | 35 | |
| energy of the beam E | MeV | 15 1.6 | |
| relative energy spread | % | 10.4 |
Energy Spread Measurement
Energy scan was done to measure the energy profile of HRRL at nominal 12 MeV. A Faraday cup was placed at the end of the 45 degree beamline to measure the electron beam current bent by the first dipole. Dipole coil current were changed by 1 A increment and the Faraday cup currents were recorded. The scan results with corresponding beam energies are shown in the table below. The relation between dipole current and beam energy is given in the appendix.
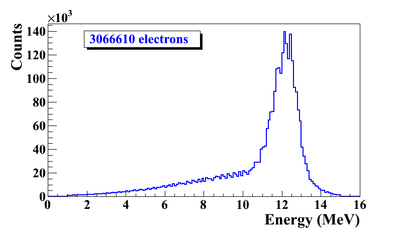
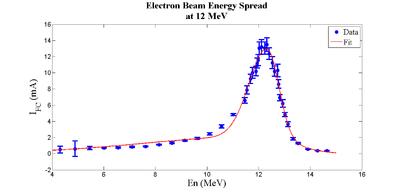
The energy distribution of HRRL can be described by two skewed Gaussian fit overlapping.
2 Skewed Gaussian Fit
The beam energy spread does not follow Gaussian distribution, but the overlapping of two skewed Gaussian found to be the best description of beam energy profile Media:Beam_Distributions_Beyond_RMS.pdf.
Sigma = 2.83516, Es = -0.57658
rms = 2.56472, skew = -0.94853
Sigma2 = 0.57440, Es2 = -0.21360
rms2 = 0.56719, skew2 = -0.34231
| parameter | Notation | First Gaussian | Second Gaussian |
| amplitude | A | 2.13894 | 10.88318 |
| mean | 12.07181 | 12.32332 | |
| sigma left | 4.46986 | 0.69709 | |
| sigma right | 1.20046 | 0.45170 |
Positron detection
DAQ setup
NaI Detectors
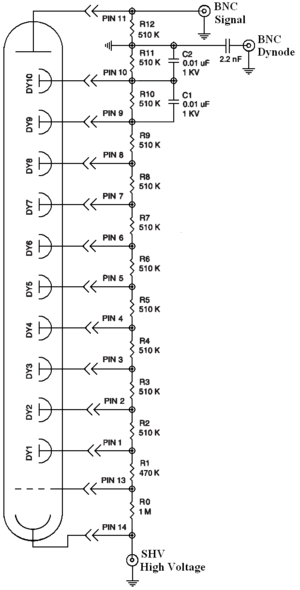
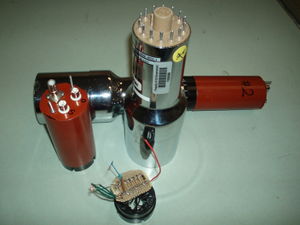
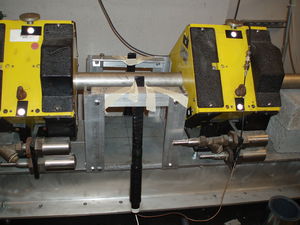
The NaI detectors have two outputs, one is at second last dynode and one anode signal. PMT base configuration of the NaI detectors is shown in the the figure. It takes ADC 5.7 s to convert analog signal to digital signal. The signal from anode was delayed 6 s by long cable and sent to the ADC.
Trigger for DAQ
The trigger for DAQ required a coincidence between one or more NaI detectors and the electron accelerator gun pulse. The last dynode signals from left and right NaI detectors were inverted using a Ortec ??? amplifier and sent to a Constant Fraction Discriminator (CFD Model specs).
RF noise from the accelerator is as large as the signal from the NaI detector. Since it is correlated in time with the gun pulse, the gun pulse was used to generate a VETO pulse that prevent the CFD from triggering on this RF noise.
After this discrimination and RF noise rejection, the discriminated dynode signals were sent to an Octalgate Generator (Model) that increased the width of the logic signals to prevent multiple pulses during a single electron pulse. Then the signals were sent to Quad Coincidence to generate AND logic between electron gun and dynode signals. The logic is set as: (Na Left && Gun Trigger) && (NaI Rgiht && Gun Trigger). This is to make sure we have trigger when photons back to back scatter to the NaI detectors when electron gun is on.
Then this trigger was sent to ORTEC Gate & Delay Generator. One of the out from gate generator was used to generate a gate to read analog signal from anode. Another output was delayed by 6 s, necessary time to convert the analog signal from anode to digital signal, and used as trigger for the DAQ.
Data Analysis
Back of the envelope calculation for e+/e- ratio
Signal extraction
For 3 MeV and on detector show all the steps
- Raw counts target in and out (calibrated energy)
- Normalized counts
- background subtracted
- Integral (zoomed in and with error)
Example of error propagation for the above
Raw counts target in and out
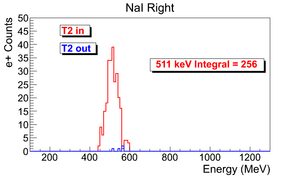
Lets take example of run#3735 for the data analysis.
The ingeral shown in read is from the background is subtracted spectrum.
| run in: 3735 | run out: 3737 | 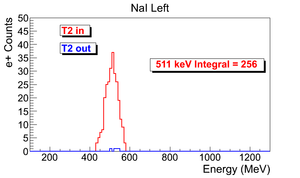
|
|
Some run parameters in 3735:
| run number | Reprate | Run time | Pulses | Events | e+ Counts NaI Detectors |
| 3735 | 300 Hz | 1002 s | 301462 | 9045 | 256 +- 16 |
Electron Rate Calculation
A scintillator placed between quadrupole 9 and quarupole 10 (shown as in the following figures) was used to estimate electron current:
The electron beam current was changed to calibrate of the scintillator. The mean of the counts in scintillator decreased in the experiment as the current decreased, the change is linear.
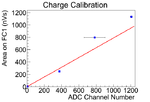
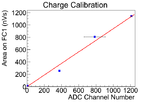
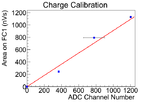
The data was fitted with three methods to find calbiration, and the average and variance them are used to find the calibration.
The first method is fit the three data points with root. The second method, the point (0,0) introduced, and the line was forced to pass through this point. The point is introduced based on physics that when there is no electron beam, scintillator should have no counts. The slope was fitted by root. The fit is done in root.
In the second method, the curved is far off from the two data points when ADC channel number is large. The third fitting method is introduced to compensate it, in which fits are done manually. Two fits were done by this method, and average and variance of two fits were obtained.
The average and variance of these three methods were used for the calibration of the scintillator.
| Fit Methods | Fit Method 1 | Fit Method 2 | Fit Method 3 | Average of Three Methods |
| Fit Curve | 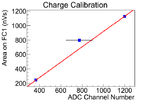
|
|
  |
|
| Calibration | nV s /ADC channel | nV s /ADC channel | nV s /ADC channel | nV s /ADC channel |
Electron Electron Rate Calculation for Run 3735
Total number of electrons in this run is
Total charge of electrons in this run is
Electron rate is
Average electron current is
Electron rate error is
Here the error on electron counts comes from the combination of the error ADC channel to Faraday cup charge area calibration factor and the error on ADC 511 keV photon peak counts.
Here, To find the average charge two methods were used. One method
Positron Rate Calculation
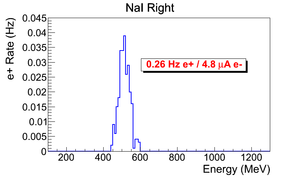
This a normalized spectrum (no background subtraction).
| run in: 3735 | 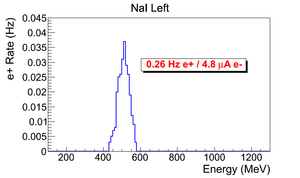
|
|
Positron rate calculated by: .
Error on positron rate calculated by: .
positron rate: .
Positron to Electron Ratio
positron to electron ratio:
positron to electron current ratio:
Errors
Background subraction
The background is taken when the annihilation target, T2, is out. The difference in T1 run and T2 out run is the measure of positrons annihilated at T2.
| Run Number | T2 Position | |
| 3735 | in | |
| 3736 | out | |
| 3737 | in |
Ratio of Positron Rate to Electron Rata
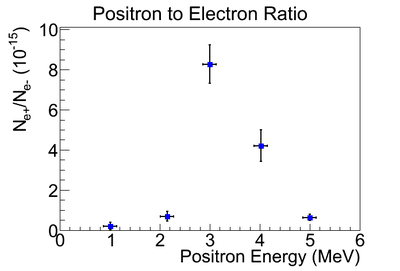
The measured ratio of positron to electron ratio is given the following table and figure.
| Energy (MeV) | Positron to Electron Ratio |
| 1 | |
| 2 | |
| 3 | |
| 4 | |
| 5 |
Sources of Systematic Errors
Determine sources of systematic errors
Error on Energy (x-axis)
To find Error on the energy, the electron beam is directed to the phosphorous screen at the end of the 90 degree beamline. The beam centered then steering away from the center. The current change on the dipole when beam is center and at the edge is 0.2 A. This is corresponding to 0.13 MeV in beam energy.
Error on Ratio (y-axis)
Error on electron beam is derived from:
Error on positron beam rate is derived from:
Annihilation target angle
Use simulation to determine how sensitive annihilation of positrons is to angle.
What is the dependence of the annihilation target angle with the probability of a positron annihilating in the target and producing a photon that is detected by the NaI detector,
What is the distribution of 511s as a function of angle phi when theta is 90 degrees? Are they uniformly produced?
Energy cut systematics
How does the positron production efficiency change when you change the range of the 511 cut.
Efficiency measurement
acceptance, quad collection efficiency,
Simulation
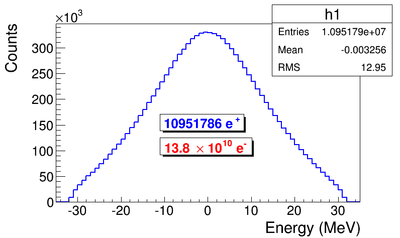
A simulation was performed using the package G4beamline(ref Muons inc) to study the processes of position generation and transportation. "G4beamline is a particle tracking and simulation program based on the Geant4 (refernce G4) toolkit that is specifically designed to easily simulate beamlines and other systems using single-particle tracking." Since the ratio of e+/e- during the positron generation process is very low (on the order of 0.001) and the positron beam loss during the transportation is large, it was necessary to divide whole process into 5 steps. A new beam event generator is created based on the results of the previous step in the simulation.
The first step generates electrons according to a measurement made of the accelerator that was used in the experiment. Electrons are transported to T1 in vacuum and as a result the interactions of the electron with T1 produce positrons. The second step is the transportation of the positrons generated at T1 to the entrance of first dipole magnet. The third step is the transportation of the positrons from the entrance of the first dipole magnet to the end of the second dipole. The fourth step is the transportation of the beam from the exit of the second dipole to the T2 target. The fifth step is the positron beam interaction with T2 and detection of the resulting 511 keV photons.
Step 1 - The Electron Beam Generation and Transpiration to T1
In this step, an electron beam is generated from the experimental measure electron beam parameters. The Twis parameters described in the earlier chapter used electron generated the beam. The energy distribution is of the beam is measured and shown in the Fig.~\ref{fig:sim-ele-En}. The blue dots are measurements and red line are the fit composed of two skewed Gaussian distributions. The fit parameters are given in the Table~\ref{tab:sim-skew-Gau}
| Amplitude | Mean (MeV) | |||
| First Gaussian | 2.14 | 12.07 | 4.47 | 1.20 |
| Second Gaussian | 10.88 | 12.32 | 0.70 | 0.45 |
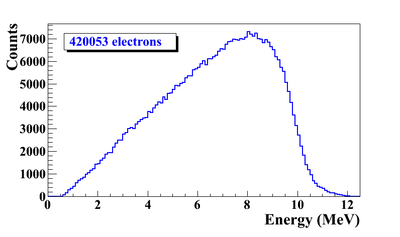
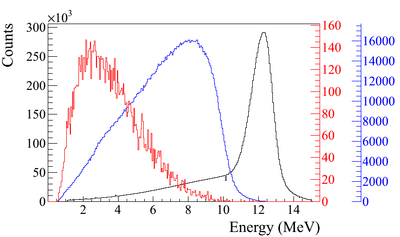
Series of virtual detectors are placed along the beamline to sample the beam. As an example, in the Fig.~\ref{fig:sim-T1-3det} shown are three detectors and the T1. The electron beam is observed at DUPT1 (Detector 25.52 mm UPstram of T1) and positrons (or electrons and photons) generated during the interaction of electron beam with T1 are observed at DT1 (Detector of T1) and DDNT1 (Detector DowN 25.52 mm stream of T1). In the Fig.~\ref{fig:sim-ele-pos}, the incoming electron beam (observed at DUPT1) energy distribution (red) and positrons generated by this electron beam (observed at DDNT1) is shown in blue.
Results
DDNT1
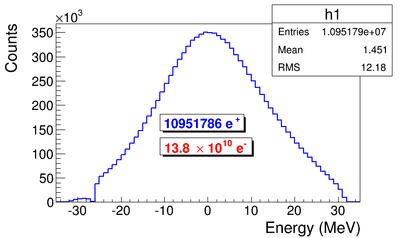
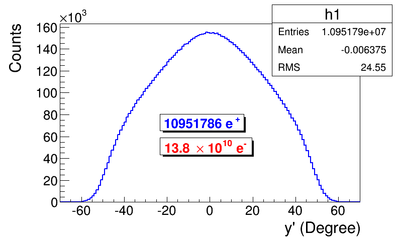
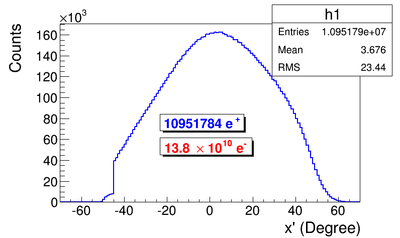
13,799,743,900 electrons were shot on T1 and resulted positron beam observed at DDNT1 is as shown below Figures.
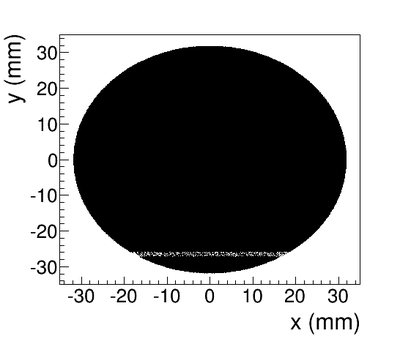
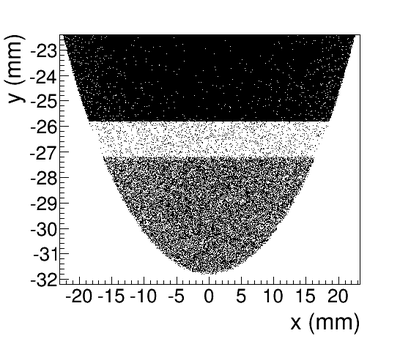
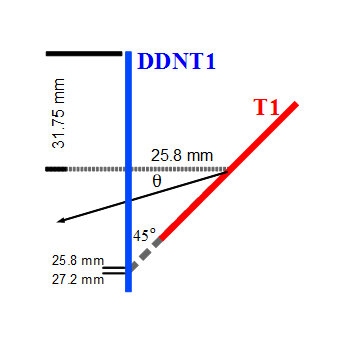
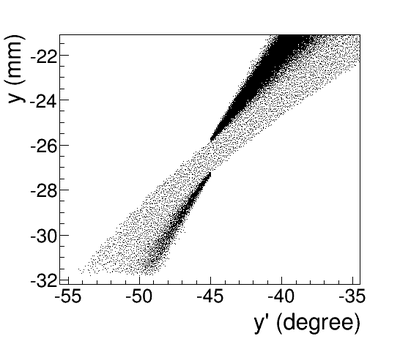
The Y-position distribution of the beam shown in Figure ~\ref{sim-DDNT1-y-vs-x} has a sharp drop in the region between -25.8 mm and -27.2 mm that corresponds to the boundary of the target T1. Figure ~\ref{sim-DDNT1-T1-geo} shows the geometry of the target T1 and the sensitive detector DDNT1. If the target size was increased, it would eventually intersected the detector DDNT1 at a distance of 25.8 mm from the beam center. A 1.4 mm wide stripe of low counts is visible on DDNT1 that is a result of the target's thickness of 1.016 mm and the 45 degree angle of intersection. (). The edge of the target does not produce many positrons compared to the face of the target, and as a result you see the stripe.
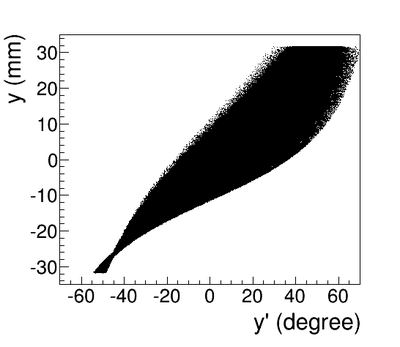
As shown in figures ~\ref{sim-DDNT1-theta-vs-y} and ~\ref{sim-DDNT1-theta-vs-y-zoom} (zoomed figure) the positron distribution decrease occures at . Positrons are emitted from both the downstream and upstream side of the target. As shown in the figure, positrons from the downstream side of the target intersect the detector at angles below 45 degrees while positrons from the upstream side of the target begin to hit the detector at angles beyond 45 degrees. The 1.4 mm gap represents the transition of positrons between these two extremes.
DQ4 and DD1
Resulted positron beam on DQ1 and DD1 are shown in below Figures.
Step 2 - Transportation of the The Positron Beam after T1 to The Entrance of The First Dipole
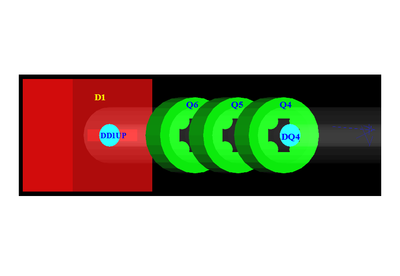
In this step, the positrons generated in the first step divided into 1~keV/c momentum bins and each bin is sampled individually since the momentum of the positrons related to their divergence. Multiple beams with individual weights generated at downstream T1 detector DDNT1 and transported to entrance of the D1. Virtual detectors are placed at the entrance of Q4 and entrance of D1 to track positrons and generate beam for next step as shown in the Fig~\ref{fig:Sim-s1-setup}.
Conclusion
Appendix
1. Dipole Coil Current vs. Beam energy
Dipole    FC        En
Coil      Current
Current   Reading
(A)       (mA)      (MeV)
8         0.5       4.3119
9         0.6       4.8896
10        0.67      5.4570
11        0.716     6.0141
12        0.752     6.5610
13        0.828     7.0975
14        0.896     7.6238
15        1.112     8.1399
16        1.328     8.6456
17        1.624     9.1411
18        1.896     9.6262
19        2.448     10.1012
20        3.36      10.5658
21        4.82      11.0201
22        6.58      11.4642
22.2      7.88      11.5518
22.5      9.24      11.6824
22.7      10.0      11.7690
23        10.2      11.8980
23.1      11.2      11.9408
23.2      11.56     11.9836
23.3      13.04     12.0262
23.5      13.2      12.1111
23.8      13.04     12.2377
24        13.48     12.3216
24.2      12.36     12.4050
24.5      11.24     12.5295
24.7      10.2      12.6119
25        10.28     12.7348
25.1      8.6       12.7756
25.2      6.92      12.8162
25.5      6.2       12.9376
25.7      4.84      13.0180
26        3.64      13.1378
26.5      1.82      13.3354
27        1.28      13.5305
28        0.56      13.9129
29        0.364     14.2850
30        0.364     14.6469
2. Radiation Footprint
References
<references/>
