Difference between revisions of "Detector Geometry Simulation"
| (7 intermediate revisions by the same user not shown) | |||
| Line 1: | Line 1: | ||
| + | <center><math>\underline{\textbf{Navigation}}</math> | ||
| + | |||
| + | [[DC_Binning_Based_On_Wire_Numbers|<math>\vartriangleleft </math>]] | ||
| + | [[VanWasshenova_Thesis#Determining_wire-theta_correspondence|<math>\triangle </math>]] | ||
| + | [[Conic_Sections|<math>\vartriangleright </math>]] | ||
| + | |||
| + | </center> | ||
| + | |||
| + | |||
| + | |||
| + | |||
=Detector Geometry= | =Detector Geometry= | ||
Examining the geometry of the Drift Chamber, we can see that the detector is similar to a hexagonal pyramid in shape. | Examining the geometry of the Drift Chamber, we can see that the detector is similar to a hexagonal pyramid in shape. | ||
| Line 74: | Line 85: | ||
| − | + | ---- | |
| − | + | ||
| + | |||
| + | <center><math>\underline{\textbf{Navigation}}</math> | ||
| − | + | [[DC_Binning_Based_On_Wire_Numbers|<math>\vartriangleleft </math>]] | |
| + | [[VanWasshenova_Thesis#Determining_wire-theta_correspondence|<math>\triangle </math>]] | ||
| + | [[Conic_Sections|<math>\vartriangleright </math>]] | ||
| − | + | </center> | |
Latest revision as of 20:21, 15 May 2018
Detector Geometry
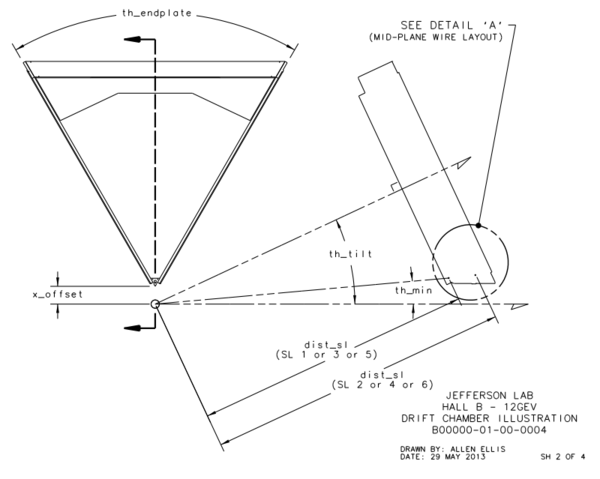
Examining the geometry of the Drift Chamber, we can see that the detector is similar to a hexagonal pyramid in shape.
From the geometry it is given that xdist, the distance between the line of intersection of the two end-plate planes and the target position, is equal to 8.298 cm and th_min, the angle from the target vertex to the the same line, is 4.694 degrees. Using this knowledge we can simulate this situation by having the end-plate planes intersect at the beam line axis. This action in effect would grant the sector to measure angles below ~5 degrees, which we can account for by limiting angles theta within the accepted detector range. The quantity dist2tgt, the distance from the target to the first guard wire plane along the normal of said plane, is given as 228.078 cm. Using the previous understanding of the distances between planes within a Superlayer:
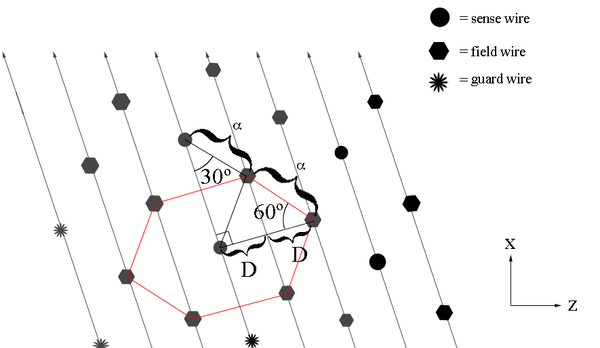
We know that the separation between levels is a constant D=.3861 cm, and that sensor layer 1 is 3 layers deep.
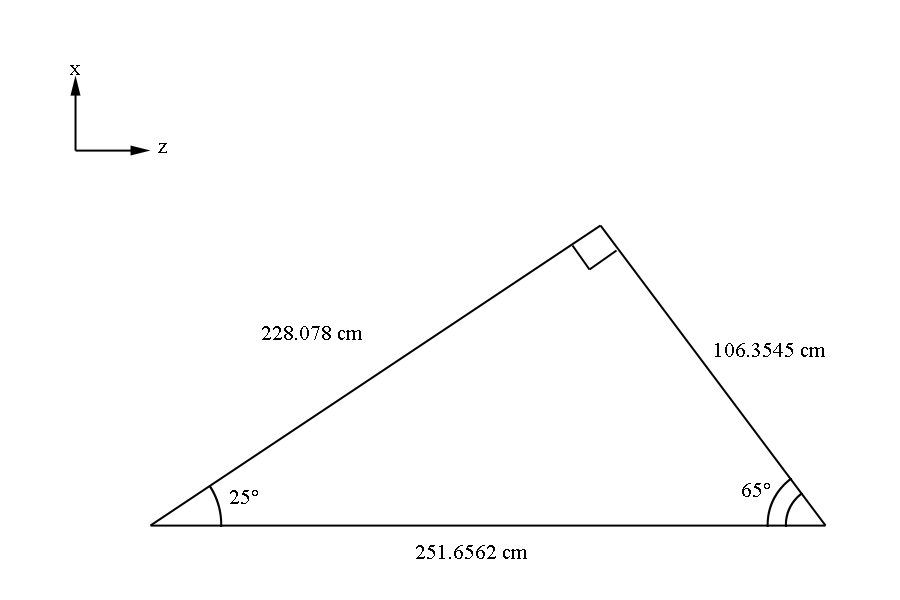
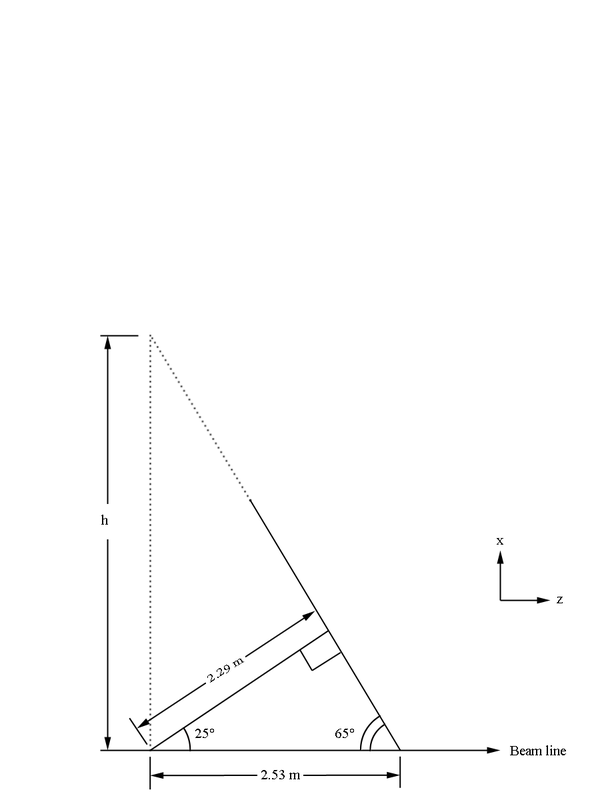
This gives us the distance to level 1 from the vertex (0,0,0) as 228.078 cm+3(0.3861) cm=229.2363 cm in the normal direction from the wire plane to the target. Using the fact that the wire planes are at 25 degrees to the beam line normal, we can approximate sector one as triangle that intersects with a line perpendicular to the beam line at the vertex position of (0,0,0) along the bisector of the triangle. This then by geometry shown in the figure below implies the distance traveling along the beam line would intersect the theoretical extension of the sector at z= 2.53 m. While this is beyond the physical constructs of the experimental design, we do this mathematical simplicity. This again is acceptable in that angles beyond the physical limitations of 40 degrees will not be simulated. From the geometry of a hexagonal pyramid, we can see that the quantity h should be
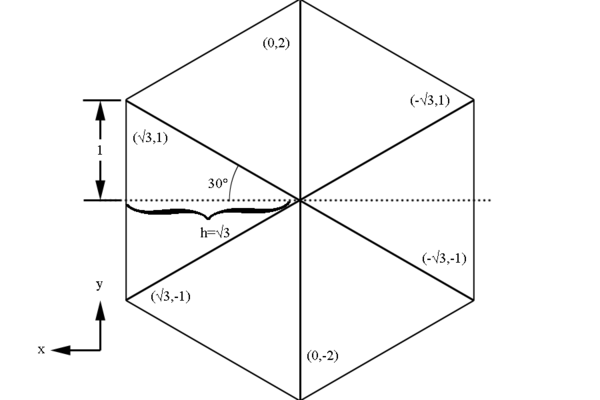
Examining the geometry of a hexagonal of h= whose coordinates are easy to calculate:
We can scale this hexagon by a factor of 3.13 to find the base of the hexagonal pyramid simulating the drift chamber geometry.
sector1=Graphics3D[{Red,Opacity[.8],Polygon[{{0,0,2.53},{3.13\[Sqrt]3,3.13,0},{3.13\[Sqrt]3,-3.13,0}}]},BoxStyle->Dashing[{0.02,0.02}],Axes->True,AxesLabel->{"x","y","z"},Ticks->None,AxesStyle->Thickness[0.01]];
sector2=Graphics3D[{GrayLevel[0.5],Opacity[.2],Polygon[{{0,0,2.53},{3.13\[Sqrt]3,-3.13,0},{0,-2*3.13,0}}]},BoxStyle->Dashing[{0.02,0.02}],Axes->True,AxesLabel->{"x","y","z"},Ticks->None,AxesStyle->Thickness[0.01]];
sector3=Graphics3D[{GrayLevel[0.5],Opacity[.2],Polygon[{{0,0,2.53},{0,-2*3.13,0},{-3.13\[Sqrt]3,-3.13,0}}]},BoxStyle->Dashing[{0.02,0.02}],Axes->True,AxesLabel->{"x","y","z"},Ticks->None,AxesStyle->Thickness[0.01]];
sector4=Graphics3D[{GrayLevel[0.5],Opacity[.2],Polygon[{{0,0,2.53},{-3.13\[Sqrt]3,-3.13,0},{-3.13\[Sqrt]3,3.13,0}}]},BoxStyle->Dashing[{0.02,0.02}],Axes->True,AxesLabel->{"x","y","z"},Ticks->None,AxesStyle->Thickness[0.01]];
sector5=Graphics3D[{GrayLevel[0.5],Opacity[.2],Polygon[{{0,0,2.53},{-3.13\[Sqrt]3,3.13,0},{0,2*3.13,0}}]},BoxStyle->Dashing[{0.02,0.02}],Axes->True,AxesLabel->{"x","y","z"},Ticks->None,AxesStyle->Thickness[0.01]];
sector6=Graphics3D[{GrayLevel[0.5],Opacity[.2],Polygon[{{0,0,2.53},{0,2*3.13,0},{3.13\[Sqrt]3,3.13,0}}]},BoxStyle->Dashing[{0.02,0.02}],Axes->True,AxesLabel->{"x","y","z"},Ticks->None,AxesStyle->Thickness[0.01]];
Bisector0Sector1=Graphics3D[Line[{{0,0,2.53},{3.13\[Sqrt]3,0,0}}]];
Bisector0perpSector1=Graphics3D[Line[{{0,0,0},{3.13\[Sqrt]3,0,0}}]];
RightAngleVertical=Graphics3D[Line[{{.25,0,.25},{.25,0,0}}]];
RightAngleHorizontal=Graphics3D[Line[{{.25,0,.25},{0,0,.25}}]];
Bisector0Cone=Graphics3D[Line[{{3.13\[Sqrt]3,0,0},{3.13\[Sqrt]3,0,2.53}}]];
Bisector0perpCone=Graphics3D[Line[{{0,0,2.53},{3.13\[Sqrt]3,0,2.53}}]];
RightAngleVertical2=Graphics3D[Line[{{3.13\[Sqrt]3-.25,0,2.53-.25},{3.13\[Sqrt]3-.25,0,2.53}}]];
RightAngleHorizontal2=Graphics3D[Line[{{3.13\[Sqrt]3-.25,0,2.53-.25},{3.13\[Sqrt]3,0,2.53-.25}}]];
BeamLine=Graphics3D[Arrow[{{0,0,-.5},{0,0,2.79}}]];
PhiCone=Graphics3D[{Blue,Opacity[.3],Cone[{{0,0,2.53},{0,0,0}},3.13\[Sqrt]3]},BoxStyle->Dashing[{0.02,0.02}],Axes->True,AxesLabel->{"x","y","z"},Ticks->None,AxesStyle->Thickness[0.01]];
Viewing the simulation,
Show[sector1,sector2,sector3,sector4,sector5,sector6,PhiCone,BeamLine,Bisector0Sector1,Bisector0perpSector1,Bisector0Cone,Bisector0perpCone,RightAngleVertical,RightAngleHorizontal,RightAngleVertical2,RightAngleHorizontal2]
It assumed that since the Moller process does not depend on the polar angle phi, it should remain constant. When the scattering angle theta, which is measured with respect to the beam line, is held constant and rotated through 360 degrees in phi, a cone is created. Using Mathematica, we can produce a 3D rendering of how the sectors for Level 1 would have to interact with a steady angle theta with respect to the beam line, as angle phi is rotated through 360 degrees.
