Difference between revisions of "Ftof p1a:Integrated Digitized Bank"
(Created page with "{| border=1 |+ Caption |- ! SubBank Number ! Variable |- | 1 | sector |- | 2 | paddle |- | 3 | ADCL |- | 4 | ADCR |- | 5 | TDCL |- | 6 | TDCR |- |…") |
|||
| (35 intermediate revisions by the same user not shown) | |||
| Line 1: | Line 1: | ||
| + | =Forward Time of Flight Detector= | ||
| + | |||
| + | In | ||
| + | each of the six sectors of CLAS12, the FTOF system is comprised of three arrays of counters, | ||
| + | referred to as panels, named panel-1a, panel-1b, and panel-2. Each panel consists of a set | ||
| + | of rectangular scintillators with a PMT on each end. Panel-1 includes the sets of counters | ||
| + | located at forward angles (roughly 5◦ | ||
| + | to 35◦ | ||
| + | ) (where two panels are necessary to meet the | ||
| + | 80 ps average time resolution requirement) and panel-2 includes the sets of counters at larger | ||
| + | angles (roughly 35◦ | ||
| + | to 45◦ | ||
| + | ). The positioning and attachment of the FTOF detector arrays | ||
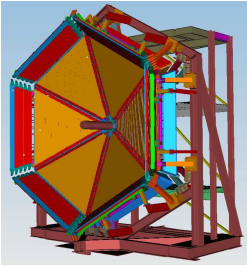
| + | to the Forward Carriage of CLAS12 are shown in Fig. 1. Each of the six panel-1a arrays | ||
| + | contains 23 counters, each of the new highly segmented panel-1b arrays contains 62 counters. | ||
| + | and each of the panel-2 arrays contains 5 counters. | ||
| + | |||
| + | |||
{| border=1 | {| border=1 | ||
| − | |+ | + | |+ FTOF |
|- | |- | ||
! SubBank Number | ! SubBank Number | ||
! Variable | ! Variable | ||
| + | ! Description | ||
|- | |- | ||
| 1 | | 1 | ||
| − | | | + | | [[Ftof_p1a:Integrated_Digitized_Bank#Sectors|Sector]] |
| + | | | ||
|- | |- | ||
| 2 | | 2 | ||
| − | | | + | | Panel |
| + | | | ||
|- | |- | ||
| 3 | | 3 | ||
| ADCL | | ADCL | ||
| + | | | ||
|- | |- | ||
| 4 | | 4 | ||
| ADCR | | ADCR | ||
| + | | | ||
|- | |- | ||
| 5 | | 5 | ||
| TDCL | | TDCL | ||
| + | | | ||
|- | |- | ||
| 6 | | 6 | ||
| TDCR | | TDCR | ||
| + | | | ||
|- | |- | ||
| 7 | | 7 | ||
| ADCLu | | ADCLu | ||
| + | | | ||
|- | |- | ||
| 8 | | 8 | ||
| ADCRu | | ADCRu | ||
| + | | | ||
|- | |- | ||
| 9 | | 9 | ||
| TDCLu | | TDCLu | ||
| + | | | ||
|- | |- | ||
| 10 | | 10 | ||
| TDCRu | | TDCRu | ||
| + | | | ||
|- | |- | ||
| 99 | | 99 | ||
| hitn | | hitn | ||
| + | | | ||
|} | |} | ||
| + | |||
| + | Geometry Description [https://www.jlab.org/Hall-B/ftof/notes/ftof_geom.pdf (CLAS12 NOTE 2016-?)] | ||
| + | |||
| + | Detector Simulation Notes [https://www.jlab.org/Hall-B/ftof/notes/ftof-mc.pdf(CLAS12 NOTE 2016-?)] | ||
| + | |||
| + | {|style="margin: 0 auto;" | ||
| + | | [[File:ftof.png | thumb | center | FTOF Detector | 600px | Figure 1: View of the FTOF counters for CLAS12 highlighting the location of the panel-1 | ||
| + | and panel-2 counters. The panel-1b counter arrays are shown in orange and the panel-2 | ||
| + | counter arrays, mounted around the perimeter of the Forward Carriage, are shown in red. | ||
| + | The panel-1a counter arrays mounted just downstream of the panel-1b arrays are not visible | ||
| + | in this picture. The Forward Carriage is roughly 10 m in diameter.]] | ||
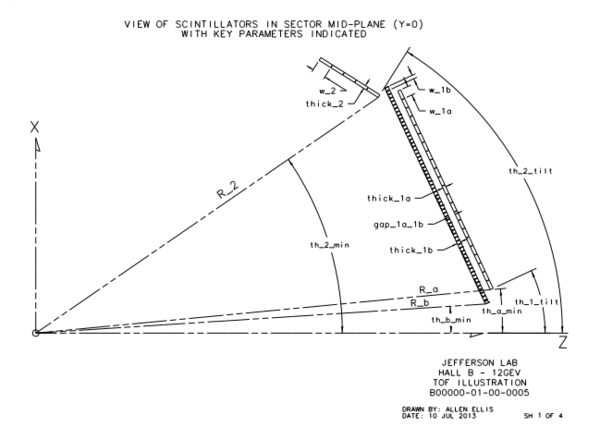
| + | | [[File:ftof_parts.png | thumb | center | FTOF Parts | 600px | Figure 2: View of the FTOF scintillators for panel-1a, panel-1b, and panel-2 in the sector | ||
| + | mid-plane with the key parameters indicated.]] | ||
| + | |} | ||
| + | |||
| + | ==Sectors== | ||
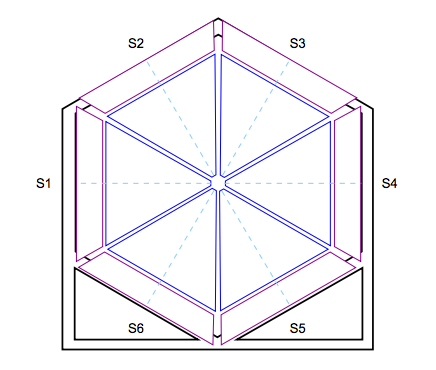
| + | [[File:ftof_sectors.png | thumb | center |FTOF Sectors | 600px |Figure 3: View of the upstream face of the Forward Carriage in Hall B showing the CLAS12 | ||
| + | sector naming conversion for Sector 1 (S1) through Sector 6 (S6). The dashed lines denote | ||
| + | the mid-planes for each sector.]] | ||
| + | |||
| + | ==Panel 1A== | ||
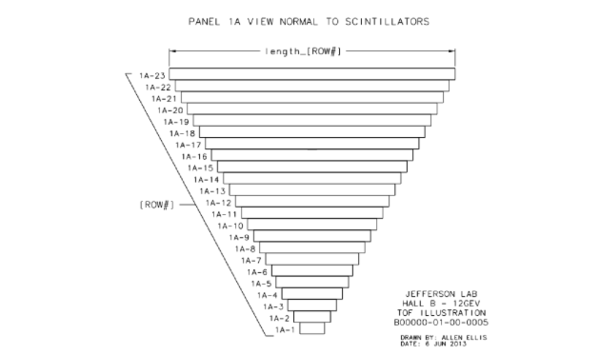
| + | [[File:ftof_p1a.png |thumb | center | FTOF Part 1 A | 600px | Figure 4: View of the face of a generic FTOF panel-1a array showing the numbering scheme | ||
| + | for the 23 scintillators that make up the counters in each of the six sectors of CLAS12.]] | ||
| + | |||
| + | ==Panel 1B== | ||
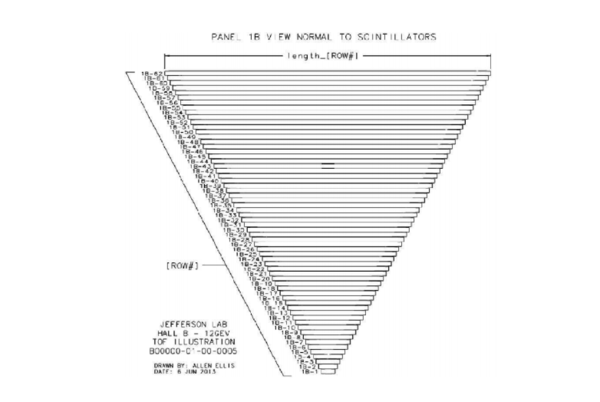
| + | [[File:ftof_p1b.png |thumb | center | FTOF Part 1 B | 600px | Figure 5: View of the face of a generic FTOF panel-1b array showing the numbering scheme | ||
| + | for the 62 scintillators that make up the counters in each of the six sectors of CLAS12.]] | ||
| + | |||
| + | ==Analog to Digital Conversion== | ||
| + | |||
| + | ===Left/Right=== | ||
| + | The simulation determines the energy deposited in a given scintillation bar from a passing | ||
| + | charged particle along its path. The path is defined between the hit entry point and the | ||
| + | hit exit point. The light generated by the passing charged particle then propagates to the | ||
| + | PMTs at either end of the bar. The conversion of the truth value of deposited energy to | ||
| + | the recorded ADC values (ADCL and ADCR) must take into account that the number of | ||
| + | generated photoelectrons at each PMT is subject to Poisson fluctuations. The digitization | ||
| + | of the FTOF ADC values for each counter hit proceeds using the following steps: | ||
| + | |||
| + | 1. Compute the energies measured by the left and right PMTs based on the deposited | ||
| + | energy and the distances along the bar from the hit point to the PMTs as given in | ||
| + | Eqs.(2) and (3). | ||
| + | |||
| + | 2. Determine the number of photoelectrons measured by the PMTs from the computed | ||
| + | values of EL and ER. Based on studies carried out with the FTOF detectors, a reasonable | ||
| + | parameterization of the number of photoelectrons N<sub>pe</sub> is given by: | ||
| + | |||
| + | <center><math> | ||
| + | N^L_{pe} = E_L \cdot CONV \cdot QE (6) | ||
| + | </math></center> | ||
| + | |||
| + | |||
| + | <center><math> | ||
| + | N^R_{pe} = E_R \cdot CONV \cdot QE (7) | ||
| + | |||
| + | </math></center> | ||
| + | |||
| + | where, | ||
| + | |||
| + | CONV = 1800 photoelectrons/MeV deposited | ||
| + | |||
| + | QE = 27% (the quantum efficiency of the PMT). | ||
| + | |||
| + | |||
| + | 3. Smear N_{pe} by a Poisson distribution. The resulting “smeared” number of photoelectrons | ||
| + | based on the actual deposited energy is given by N^{SMR}_pe . | ||
| + | |||
| + | 4. Determine the smeared values of EL and ER using: | ||
| + | |||
| + | <center><math> | ||
| + | E^SMR_L =/frac{N^{L,SMR}_pe}{CONV · QE} , (8) | ||
| + | |||
| + | E^SMR_R =/frac{N^{R,SMR}_pe}{CONV · QE} . (9) | ||
| + | |||
| + | 5. Determine the “measured” values of the left and right ADCs using: | ||
| + | ADCL = | ||
| + | E | ||
| + | SMR | ||
| + | L | ||
| + | K | ||
| + | · | ||
| + | 1 | ||
| + | GL | ||
| + | = | ||
| + | E | ||
| + | SMR | ||
| + | L | ||
| + | K | ||
| + | · | ||
| + | exp µ−yL | ||
| + | λL | ||
| + | ¶ | ||
| + | exp µ−yR | ||
| + | λR | ||
| + | ¶¸−1/2 | ||
| + | , (10) | ||
| + | ADCR = | ||
| + | E | ||
| + | SMR | ||
| + | R | ||
| + | K | ||
| + | · | ||
| + | 1 | ||
| + | GR | ||
| + | = | ||
| + | E | ||
| + | SMR | ||
| + | R | ||
| + | K | ||
| + | · | ||
| + | exp µ−yL | ||
| + | λL | ||
| + | ¶ | ||
| + | exp µ−yR | ||
| + | λR | ||
| + | ¶¸−1/2 | ||
| + | . (11) | ||
| + | Here, | ||
| + | • The term | ||
| + | K = | ||
| + | | ||
| + | | ||
| + | ³ | ||
| + | dE | ||
| + | dx ´ | ||
| + | MIP | ||
| + | · t | ||
| + | ADCMIP | ||
| + | | ||
| + | (12) | ||
| + | is a conversion factor to go from ADC channel to energy. | ||
| + | • ADCMIP = ADC value for normally incident MIPs at the center of the scintillation | ||
| + | bar | ||
| + | • | ||
| + | ³ | ||
| + | dE | ||
| + | dx ´ | ||
| + | MIP | ||
| + | = energy loss for MIPs in the scintillation bars (1.956 MeV/cm) | ||
| + | • t = scintillation bar thickness (cm) | ||
| + | Note that in the Monte Carlo ADCL,R actually represents ADCL,R − P EDL,R, the | ||
| + | pedestal-subtracted ADC value from the data. Also note that the database includes separate | ||
| + | values for λL and λR. In practice these values are the same such that λL = λR = λ. | ||
| + | |||
| + | ===U=== | ||
| + | |||
| + | ==Time to Digital Conversion== | ||
| + | ===Left/Right=== | ||
| + | |||
| + | ===U=== | ||
| + | |||
| + | |||
| + | ==Number of Hits== | ||
Latest revision as of 19:05, 22 July 2016
Forward Time of Flight Detector
In each of the six sectors of CLAS12, the FTOF system is comprised of three arrays of counters, referred to as panels, named panel-1a, panel-1b, and panel-2. Each panel consists of a set of rectangular scintillators with a PMT on each end. Panel-1 includes the sets of counters located at forward angles (roughly 5◦ to 35◦ ) (where two panels are necessary to meet the 80 ps average time resolution requirement) and panel-2 includes the sets of counters at larger angles (roughly 35◦ to 45◦ ). The positioning and attachment of the FTOF detector arrays to the Forward Carriage of CLAS12 are shown in Fig. 1. Each of the six panel-1a arrays contains 23 counters, each of the new highly segmented panel-1b arrays contains 62 counters. and each of the panel-2 arrays contains 5 counters.
| SubBank Number | Variable | Description |
|---|---|---|
| 1 | Sector | |
| 2 | Panel | |
| 3 | ADCL | |
| 4 | ADCR | |
| 5 | TDCL | |
| 6 | TDCR | |
| 7 | ADCLu | |
| 8 | ADCRu | |
| 9 | TDCLu | |
| 10 | TDCRu | |
| 99 | hitn |
Geometry Description (CLAS12 NOTE 2016-?)
Detector Simulation Notes NOTE 2016-?)
Sectors
Panel 1A
Panel 1B
Analog to Digital Conversion
Left/Right
The simulation determines the energy deposited in a given scintillation bar from a passing charged particle along its path. The path is defined between the hit entry point and the hit exit point. The light generated by the passing charged particle then propagates to the PMTs at either end of the bar. The conversion of the truth value of deposited energy to the recorded ADC values (ADCL and ADCR) must take into account that the number of generated photoelectrons at each PMT is subject to Poisson fluctuations. The digitization of the FTOF ADC values for each counter hit proceeds using the following steps:
1. Compute the energies measured by the left and right PMTs based on the deposited energy and the distances along the bar from the hit point to the PMTs as given in Eqs.(2) and (3).
2. Determine the number of photoelectrons measured by the PMTs from the computed values of EL and ER. Based on studies carried out with the FTOF detectors, a reasonable parameterization of the number of photoelectrons Npe is given by:
where,
CONV = 1800 photoelectrons/MeV deposited
QE = 27% (the quantum efficiency of the PMT).
3. Smear N_{pe} by a Poisson distribution. The resulting “smeared” number of photoelectrons
based on the actual deposited energy is given by N^{SMR}_pe .
4. Determine the smeared values of EL and ER using:
E^SMR_L =/frac{N^{L,SMR}_pe}{CONV · QE} , (8)
E^SMR_R =/frac{N^{R,SMR}_pe}{CONV · QE} . (9)
5. Determine the “measured” values of the left and right ADCs using: ADCL = E SMR L K · 1 GL = E SMR L K · exp µ−yL λL ¶ exp µ−yR λR ¶¸−1/2 , (10) ADCR = E SMR R K · 1 GR = E SMR R K · exp µ−yL λL ¶ exp µ−yR λR ¶¸−1/2 . (11) Here, • The term K = ³ dE dx ´ MIP · t ADCMIP (12) is a conversion factor to go from ADC channel to energy. • ADCMIP = ADC value for normally incident MIPs at the center of the scintillation bar • ³ dE dx ´ MIP = energy loss for MIPs in the scintillation bars (1.956 MeV/cm) • t = scintillation bar thickness (cm) Note that in the Monte Carlo ADCL,R actually represents ADCL,R − P EDL,R, the pedestal-subtracted ADC value from the data. Also note that the database includes separate values for λL and λR. In practice these values are the same such that λL = λR = λ.
