Difference between revisions of "20min run peak sensing histograms"
Jump to navigation
Jump to search
| Line 1: | Line 1: | ||
| − | = Cathode Voltage Effect on the Peak sensing Spectrum | + | = Cathode Voltage Effect on the Peak sensing Spectrum= |
| − | + | ||
| + | All the measurements have the same GEM voltage 2.87 kV, just cathode voltage changes. | ||
| Line 9: | Line 10: | ||
|10/23|| 3.12 || Open ||off || 7899|| | |10/23|| 3.12 || Open ||off || 7899|| | ||
|- | |- | ||
| − | | 10/16||Closed || off || | + | | 10/16||3.12 ||Closed || off || 7900|| |
| − | + | ||
| + | |||
| + | |} | ||
Revision as of 17:27, 23 October 2014
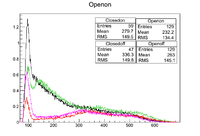
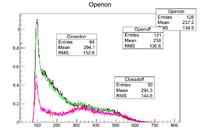
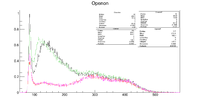
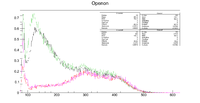
Cathode Voltage Effect on the Peak sensing Spectrum
All the measurements have the same GEM voltage 2.87 kV, just cathode voltage changes.
| Date | CATH. Volatage (kV) | Shutter | source | run number | Notes |
| 10/23 | 3.12 | Open | off | 7899 | |
| 10/16 | 3.12 | Closed | off | 7900 |
|
GEM-2.87 kV CATH-3.435 kV
Test runs
GO BACK [1]
