Difference between revisions of "DAQ"
| (One intermediate revision by the same user not shown) | |||
| Line 29: | Line 29: | ||
1- The area of the detector kipton window increased to the same size of the GEM cards( 10X10 cm). | 1- The area of the detector kipton window increased to the same size of the GEM cards( 10X10 cm). | ||
| − | 2- The distance of the cathode from the first GEM increased up to | + | 2- The distance of the cathode from the first GEM increased up to 10 mm. previously the distance was about 3-4 mm. |
Increasing the drift distance demands an increase in cathode potential to maintain the same values of the electric field in the old setup. | Increasing the drift distance demands an increase in cathode potential to maintain the same values of the electric field in the old setup. | ||
Latest revision as of 14:17, 21 October 2013
DAQ system description
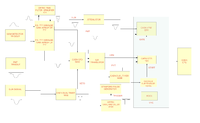
The data acquisition system used for recording the data that collected from the detector trigger output consists of CAEN V792 anolog-digital converter, V760 scalar, ortec gate and delay, ortec timing filter amplifier 474,ortec counter 875, P.S. 710 octal discriminator, and P.S. eight channel variable gain amplifier 777, and a CPU supported by CODA and ROOT. The data were collected manually from ortec counter, and digitally using the CAEN modules that were connected together and to the CPU by a VME crate.
LDS Using CAEN V792 QDC
GEM performance QDC data graphs
- Electronics Flow CHart Using QDC
Electronic Setup for the Neutron detector at the IAC
- Summary
The detector is installed in the IAC after modifications took place in the detector design.
The modifications are:
1- The area of the detector kipton window increased to the same size of the GEM cards( 10X10 cm).
2- The distance of the cathode from the first GEM increased up to 10 mm. previously the distance was about 3-4 mm.
Increasing the drift distance demands an increase in cathode potential to maintain the same values of the electric field in the old setup.
3- The detector is installed in a wooden box, in addition to a plastic scintillator which was placed to cover part of the detector window.
- Electronics Flow Chart Using QDC and TDC
Go Back [1]

