Difference between revisions of "JLAB Positron Source DOE Award DE-SC0002600"
| (56 intermediate revisions by 2 users not shown) | |||
| Line 18: | Line 18: | ||
=Final Report= | =Final Report= | ||
| + | |||
| + | |||
| + | [[File:Positron2013_FinalReport.pdf]] | ||
DOE Award #: DE-SC0002600 | DOE Award #: DE-SC0002600 | ||
| Line 39: | Line 42: | ||
===Initial Positron production measurement=== | ===Initial Positron production measurement=== | ||
| − | + | The first year of this work focused on performing positron production measurements were performed at the Idaho Accelerator Center (IAC) to evaluate the signal to background level and detector performance. Figure ~\ref{fig:Year1BeamLine} depicts the beam line used for these measurements. A 25 MeV linac, pulsed at 300 Hz, was used to accelerate electrons to 10 MeV. The electrons were bunched into 100 ns wide pulses with a peak current of 40 mA and transported to a 2 mm thick tungsten target located between two dipoles. The second dipole was set to transport 3 MeV electrons or positrons to a shielded cell that housed an HpGe and NaI detector. | |
| Line 80: | Line 83: | ||
| − | The first year's research experience was used to design a beam line specifically for use as a positron source. The first step was to | + | The experience from the first year's research experience was used in the second year of this work to design and construct a beam line specifically for use as a positron source. The first step was to increase the available space for a beam line by moving the High Repetition Rate Linac (HRRL) cavity from the center of the Physic's beam lab room to a corner and add a system of quads and steering magnets to improve beam transport. The second step was to measure the emittance of the linac and use those measurements as the input parameters of a beam line simulation to optimize positron transport. The installation of a positron production target (T1) and an annihilation target (T2) was done to complete the linac based positron source. |
==== Beamline Optimization==== | ==== Beamline Optimization==== | ||
| Line 91: | Line 94: | ||
| − | + | As shown in the Fig.~\ref{fig:app-hrrl-line}, the HRRL's accelerator cavity was relocated to provide enough space for a beam line that would allow the magnet elements needed to construct an achromat. The beam elements are described in Table~\ref{tab:app-hrrl-coordinates}. Quadrupole (Q1-Q9) and dipole magnets (D1 \& D2) were added to the new beam line as well as an optical transmission radiator (OTR), labeled S1, to measure the beam emittance and a YAG screen (S2) to locate the beam after it is deflected by the first dipole. Labels FC1, FC2, and FC3 in Figure~\ref{fig:app-hrrl-line} are Faraday cups installed to measure the electron beam current. Energy slits (EnS) were installed to restrict the beam's energy/momentum spread after the first dipole. A retractable tungsten foil target (T1) was placed between the 1st and 2nd triplets and used to produce positrons from the bremsstrahlung photons produced by electrons within the Tungsten target. | |
| − | + | A four foot thick wall separates the accelerator side from the experimental cell. A beam pipe at the end of the 90 degree beamline goes through a hole in this wall and delivers the beam from the accelerator side to the experimental cell. The positron detection system consisting of two NaI detectors was placed at the end of the beamline in the experimental cell side as shown in the Fig.~\ref{fig:app-hrrl-line}. | |
=====HRRL emittance measurements===== | =====HRRL emittance measurements===== | ||
| − | + | The accelerator's emittance was measured using an optical transmission radiator (OTR) and one of the quadrupole magnets close to the accelerators exit port. Figure~\ref{fig:emittanceSetup} illsutrates the components used for the emittance measurement. The visible radiation produced by the electrons traversing the OTR screen was captured with a JAI digital camera that was calibrated by illuminating the 31.75~mm diameter OTR frame with a light emitting diode. The horizontal and vertical calibration factors of 0.04327~\pm~0.00016~mm/pixel and 0.04204~\pm~0.00018~mm/pixel, respectively, were determined using image processing software was to inscribe a circle around the OTR inner frame in units of pixels. The digital images intensity measured by the JAI camera was recorded in a 2-D matrix format and projections on both axes were taken to perform a Gaussian fit. The observed image profiles were not well described by a single Gaussian distribution. The profiles may be described using a Lorentzian distribution, however, the rms of the Lorentzian function is not defined. The super Gaussian distribution seems to be the best option~[11], because rms values may be directly extracted. Figure~\ref{fig:emittanceSetup} shows the square of the rms (\sigma^2_{s}) vs k_1L for x (horizontal) and y (vertical) beam projections along with the parabolic fits using Eq.~\ref{par_fit}. The emittances and Twiss parameters from these fits are summarized in Table~\ref{results}. A simulation used these input parameters to optimize positron transport and to quantify the expected beam loss. | |
| − | |||
| − | |||
{| border="0" style="background:transparent;" align="center" | {| border="0" style="background:transparent;" align="center" | ||
|- | |- | ||
| − | |[[File: | + | |[[File:Hrrl_2011_mar_emit_test_quad_scan_quad.png| 200 px]] |
|| [[image: HRRL_Mar_Emit_par_fit_1.png| 200 px |thumb|Fig. Square of rms values and parabolic fittings. .]] | || [[image: HRRL_Mar_Emit_par_fit_1.png| 200 px |thumb|Fig. Square of rms values and parabolic fittings. .]] | ||
|| [[image: HRRL_Mar_Emit_par_fit_2.jpg| 200 px |thumb|Fig. Square of rms values and parabolic fittings. .]] | || [[image: HRRL_Mar_Emit_par_fit_2.jpg| 200 px |thumb|Fig. Square of rms values and parabolic fittings. .]] | ||
|} | |} | ||
| − | |||
{|border="2" colspan = "20" | {|border="2" colspan = "20" | ||
| Parameter || Unit || Value || | | Parameter || Unit || Value || | ||
| Line 137: | Line 137: | ||
| − | + | A measurement of the electron energy distribution transported to the first dipole (D1) was performed after installing the new beam line. A Faraday cup was placed at the end of the 45 degree beamline to measure the electron beam current that is transported by the first dipole. The dipole magnetic field was mapped in order to determine the transported electron energy as a function of the dipole current. The Faraday cup current was recorded for each 1 A increment of the dipole current. The results in terms of the expected beam energy for each dipole current setting, as predicted by the measured magnetic field map, are shown in Figure~\ref{fig:HRRLenergyScan}. Table~\ref{table:HRRLescanFit} list the parameters of a skewed double Gaussian distribution fit. | |
| − | |||
| − | |||
[[File:hrrl_17May2012_12MeV_En_Spread2.png | 400 px]] | [[File:hrrl_17May2012_12MeV_En_Spread2.png | 400 px]] | ||
| − | + | [[Media:Beam_Distributions_Beyond_RMS.pdf]]. | |
| Line 162: | Line 160: | ||
|} | |} | ||
| − | ==== Positron | + | ===Positron Production Performance=== |
| + | |||
| + | The final year of this work was dedicated to measuring the performance of this linac based positron source. Two NaI detectors were calibrated and installed into the experimental side of the HRRL along with several layers of lead shielding to minimize photon contamination. The performance measurements first focused on establishing the veracity that the detected photons were from positrons annihilating in target T2 by using a permanent magnet to deflect positrons on the accelerator side and then by removing the annihilation target T2. The energy distribution of the the positrons produced using a 10 MeV electron beam was also measured. The results were compared with a simulation of the beam line to reconcile the observed beam loss. | ||
| + | |||
| + | |||
| + | ====Positron Detection==== | ||
| + | |||
| + | NaI crystals, shown as in the Fig.~\ref{fig:PMT}, were used to detect 511~keV photons emmited by positron annihilating in the target T2. Originally, the detector's output pulse length was around 400~$\mu$s. New PMT bases were constructed to shorten the time of this response to less than 1~$\mu$s. The NaI detector's PMT base was also altered to include both a dynode and an anode output. The crystal attached to these PMTs is a SAINT-GOBAIN CRYSTAL \& DETECTORS (MOD. 3M3/3) NaI crystal with a dimension of $3"\times3"$. The PMT base HV was set to approximately 1150~V. The anode output pulse was summed over a time interval of 2 $\mu$s by a CAEN V792 ADC. The NaI detectors were calibrated using a Na-22 and a Co-60 sources with photon peaks indicated in the Table~\ref{tab:Na22_Co60}. The Fig.~\ref{fig:NaI_Co60_Scope} is the oscilloscope image of Co-60 photon pulses incident on the detector with new PMT. The calibrated NaI detector spectrum of Na-22 and Co-60 sources are shown in the Fig.~\ref{fig:NaI-Calb}. The NaI measurement of the Na-22 511 keV photons has a sigma of about 18 keV. | ||
| + | \begin{figure} \centering \includegraphics[scale=0.4]{3-Apparatus/NaI_Co60_Scope.png} \caption{Pulses of the Co-60 source obtained using new PMT. The amplitude of of the pulse is about 60~mV. The rise time of the pulse is larger than 50 ns, and the fall time is larger than 700~ns.} \label{fig:NaI_Co60_Scope} \end{figure} | ||
| − | { | + | \begin{figure} \centering \includegraphics[scale=0.75]{3-Apparatus/Figures/NaI_Calbration/NaI_Calb1.eps} \caption{The calibrated NaI spectrum of Na-22 and Co-60 sources.} \label{fig:NaI-Calb} \end{figure} |
| − | |||
| − | |||
| − | |||
| − | |||
| − | |||
| − | |||
{| border="1" |cellpadding="20" cellspacing="0 | {| border="1" |cellpadding="20" cellspacing="0 | ||
| Line 181: | Line 181: | ||
|A drawing fo the NaI detectors used to measure 511 keV photons from the annihlation of positrons by T2. || A picture of detectors along with modified bases. || A calibrated energy distribution using a Co-60 and Na-22 button source. | |A drawing fo the NaI detectors used to measure 511 keV photons from the annihlation of positrons by T2. || A picture of detectors along with modified bases. || A calibrated energy distribution using a Co-60 and Na-22 button source. | ||
|} | |} | ||
| + | |||
| + | |||
| + | The NaI detectors were installed in the shielded experimental cell as shown in Figure~\ref{fig:app-hrrl-line}. The annihilation target, shown in Figure~\ref{fig:AnnihilationTarget}, intercepted the positron beam causing some of the positrons to annihilate and emit the back-to-back 511 keV photons that characterize the annihilation. Figure~\ref{fig:511peak} represents the photon energy observed by the NaI detectors for three cases. First, a peak in the photon energy spectrum was observed which had an energy consistent with the expected 511 keV annihilation energy. Second, a permanent magnet deflecting positrons on the accelerator side of the experiment cell caused the previously observed 511 keV peak to diminish substantially. The 511 keV signal was also drastically reduced when the annihilation target T2 is removed from the beam line. We argue, based on these results, that the observed signal is predominantly caused by positrons annihilating in the target with very little signal from positrons that are produced by photon pair creation within T2. | ||
| + | |||
| Line 188: | Line 192: | ||
|- | |- | ||
|run in: 3735 | |run in: 3735 | ||
| − | ||[[File: | + | ||[[File:Sadiq_Thesis_Figs_4p6_1.png|300 px]] |
| − | ||[[File: | + | ||[[File:Sadiq_Thesis_Figs_4p6_2.png|300 px]] |
|- | |- | ||
| Singles spectra for each detector with and without the annihilation target inserted | | Singles spectra for each detector with and without the annihilation target inserted | ||
|} | |} | ||
| − | This a | + | Figure~\ref{fig:511Coinc} represents the positron production rates observed when the characteristic 511 keV photons are measured by both NaI detector in coincidence. Also shown is the rate observed when the annihilation target (T2) is removed from the beam line, indicating an accidental coincidence rate that is negligible. This measurement indicates a that a positron per second was produced using a 19 \muA electron current. The energy dependence of the positron production efficiency was measured by changing the current on dipoles D1 and D2 and is shown in Figure~\ref{fig:e+e-eff}. A simulation was used to estimate the beam loss experienced when transporting positrons from the production target T1. A comparison of the measurements with a beam line simulation appears in Figure~\ref{fig:e+e-eff}. |
| + | |||
{| border="1" | {| border="1" | ||
| Line 206: | Line 211: | ||
| − | + | [[File:Sadiq_Thesis_Figs_5p1.png | 400 px]] | |
| − | + | [[File:Sadiq_Thesis_Figs_3p11.png | 200 px]] | |
| − | [[File: | ||
====Things not accomplished==== | ====Things not accomplished==== | ||
| Line 218: | Line 222: | ||
Positron current was too low for a FC measurement | Positron current was too low for a FC measurement | ||
| + | |||
| + | ==== Positron converter target==== | ||
| + | |||
| + | |||
| + | |||
| + | {| border="1" |cellpadding="20" cellspacing="0 | ||
| + | |- | ||
| + | | [[File:HRRL_Beam_Rot_Tar_Sys_Mot16.png | 200 px]]|| | ||
| + | |- | ||
| + | |A picture of the rotating target motor with cooling lines. | ||
| + | |} | ||
Latest revision as of 20:35, 4 October 2013
Award Info
8/15/09 - 8/14/2012
Funds Obligated: $381,509
Funds Requested: $411,509
Sponsored Project Proposal Number : 8-17
DOE Award Number : DE-SC0002600
Accounts set up on 10/14/09
Banner Index : RACL39 Account Numer : 684-143-40
Fund: X10165, Org code: 640000, Program : 040R0
Final Report
File:Positron2013 FinalReport.pdf
DOE Award #: DE-SC0002600
Project Title: The Development of a Positron Source for JLab at the IAC
Date: 8/1/13
Period covered: 8/15/09-8/14/2013 (Final Report)
Use the URL below to submit the final report
http://www.osti.gov/elink-2413
Accomplishments
The performance of positron source using a quad triplet collection system has been measured using the support from this award. The first year of research accomplished its goal of performing preliminary measurements of positron production and found that efficiency to be positrons per incident electron. The second year of work focused on designing an achromat beam line along with a tungsten target to optimize the production of positrons with an energy dispersion less than 30 \%. The third year measured the performance of a linac based, achromatic positron source and observed a chromaticity of 60\% while improving the positron production efficiency measured in year one by more than a factor of two. Based on this work, we believe that the low positron efficiency observed can be greatly improved by placing the production target within a magnetic collection field instead of outside.
Initial Positron production measurement
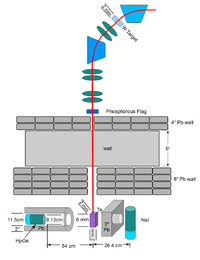
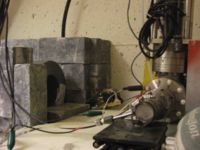
The first year of this work focused on performing positron production measurements were performed at the Idaho Accelerator Center (IAC) to evaluate the signal to background level and detector performance. Figure ~\ref{fig:Year1BeamLine} depicts the beam line used for these measurements. A 25 MeV linac, pulsed at 300 Hz, was used to accelerate electrons to 10 MeV. The electrons were bunched into 100 ns wide pulses with a peak current of 40 mA and transported to a 2 mm thick tungsten target located between two dipoles. The second dipole was set to transport 3 MeV electrons or positrons to a shielded cell that housed an HpGe and NaI detector.
 |
|
| The beam line used for an initial set of positron production measurements | A picture of the HgPe detector entrance and Farraday cup. |
| Item | Description |
| Tantalum Foil | 6 mm thick 20 mm x 20 mm area |
| Tungsten Foil | 2 mm thick 20 mm x 20 mm area |
| Phosphorus Flag | 1 mil aluminum backing |
| Media:HpGe_Crystal_GEM-60195-Plus-P.pdf | 81.3mm Diameter, 55.5mm Length |
| NaI detector |
A positron transported to the shielded cell would impinge onto a 6mm thick Tantalum foil where it would annihilate and produce two photons. An high purity germanium (HpGe) detector and an Sodium Iodide (NaI) detector were place at 90 degree angles with respect to the Tantalum target in order to detect the characteristic 511 keV photon that would emerge back to back when a positron annihilates after thermalizing in the Tantalum. The analog output of both detectors was measured using a multi-channel analyzer, model MPA-3 manufactured by FAST ComTec Communication Technology GmbH, equipped with a 12 bit ADC.
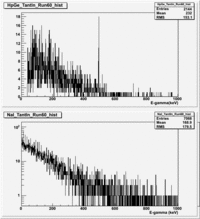
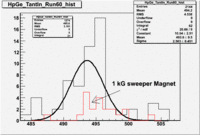
Figure~\ref{fig:IACpositronSpec} shows the photon energy spectrum observed by each detector. A clear peak at a photon distribution was observed using the HpGe detector while the NaI spectrum was less clear. A permanent magnet was inserted to deflect charged particles away from the Tantalum annihilation target. Figure~\ref{fig:IACpositronSpec} shows the reduction in the 511 keV peak observed by the HpGe detector when the magnet is inserted. Although the HpGe detector calibration was off by 15 keV, the magnet indicated that positively charged particles were being produced and transported to the shielded cell. We did not have the diagnostic equipment needed to determine if those particles were from the Tungsten converter target or created somewhere along the beam line. Our next measurement would use retractable targets to determine the origin of the positively charged particles producing the 511 keV photons.
The design of a linac based positron source
The experience from the first year's research experience was used in the second year of this work to design and construct a beam line specifically for use as a positron source. The first step was to increase the available space for a beam line by moving the High Repetition Rate Linac (HRRL) cavity from the center of the Physic's beam lab room to a corner and add a system of quads and steering magnets to improve beam transport. The second step was to measure the emittance of the linac and use those measurements as the input parameters of a beam line simulation to optimize positron transport. The installation of a positron production target (T1) and an annihilation target (T2) was done to complete the linac based positron source.
Beamline Optimization
 |
|
| HRRL beamline for positron generation. | A picture of the HRRL positron beam line. |
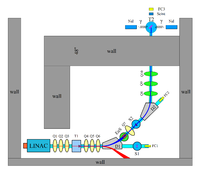
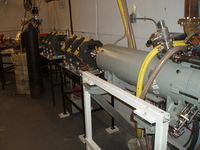
As shown in the Fig.~\ref{fig:app-hrrl-line}, the HRRL's accelerator cavity was relocated to provide enough space for a beam line that would allow the magnet elements needed to construct an achromat. The beam elements are described in Table~\ref{tab:app-hrrl-coordinates}. Quadrupole (Q1-Q9) and dipole magnets (D1 \& D2) were added to the new beam line as well as an optical transmission radiator (OTR), labeled S1, to measure the beam emittance and a YAG screen (S2) to locate the beam after it is deflected by the first dipole. Labels FC1, FC2, and FC3 in Figure~\ref{fig:app-hrrl-line} are Faraday cups installed to measure the electron beam current. Energy slits (EnS) were installed to restrict the beam's energy/momentum spread after the first dipole. A retractable tungsten foil target (T1) was placed between the 1st and 2nd triplets and used to produce positrons from the bremsstrahlung photons produced by electrons within the Tungsten target.
A four foot thick wall separates the accelerator side from the experimental cell. A beam pipe at the end of the 90 degree beamline goes through a hole in this wall and delivers the beam from the accelerator side to the experimental cell. The positron detection system consisting of two NaI detectors was placed at the end of the beamline in the experimental cell side as shown in the Fig.~\ref{fig:app-hrrl-line}.
HRRL emittance measurements
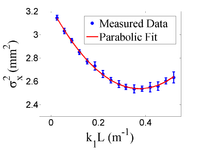
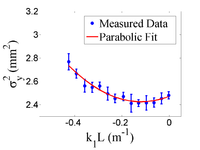
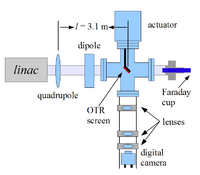
The accelerator's emittance was measured using an optical transmission radiator (OTR) and one of the quadrupole magnets close to the accelerators exit port. Figure~\ref{fig:emittanceSetup} illsutrates the components used for the emittance measurement. The visible radiation produced by the electrons traversing the OTR screen was captured with a JAI digital camera that was calibrated by illuminating the 31.75~mm diameter OTR frame with a light emitting diode. The horizontal and vertical calibration factors of 0.04327~\pm~0.00016~mm/pixel and 0.04204~\pm~0.00018~mm/pixel, respectively, were determined using image processing software was to inscribe a circle around the OTR inner frame in units of pixels. The digital images intensity measured by the JAI camera was recorded in a 2-D matrix format and projections on both axes were taken to perform a Gaussian fit. The observed image profiles were not well described by a single Gaussian distribution. The profiles may be described using a Lorentzian distribution, however, the rms of the Lorentzian function is not defined. The super Gaussian distribution seems to be the best option~[11], because rms values may be directly extracted. Figure~\ref{fig:emittanceSetup} shows the square of the rms (\sigma^2_{s}) vs k_1L for x (horizontal) and y (vertical) beam projections along with the parabolic fits using Eq.~\ref{par_fit}. The emittances and Twiss parameters from these fits are summarized in Table~\ref{results}. A simulation used these input parameters to optimize positron transport and to quantify the expected beam loss.
|
| Parameter | Unit | Value | |
| projected emittance | m | 0.37 0.02 | |
| projected emittance | m | 0.30 0.04 | |
| -function | m | 1.40 0.06 | |
| -function | m | 1.17 0.13 | |
| -function | rad | 0.97 0.06 | |
| -function | rad | 0.24 0.07 | |
| micro-pulse charge | pC | 11 | |
| micro-pulse length | ps | 35 | |
| energy of the beam E | MeV | 15 1.6 | |
| relative energy spread | % | 10.4 |
HRRL energy spread
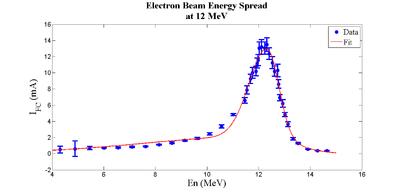
A measurement of the electron energy distribution transported to the first dipole (D1) was performed after installing the new beam line. A Faraday cup was placed at the end of the 45 degree beamline to measure the electron beam current that is transported by the first dipole. The dipole magnetic field was mapped in order to determine the transported electron energy as a function of the dipole current. The Faraday cup current was recorded for each 1 A increment of the dipole current. The results in terms of the expected beam energy for each dipole current setting, as predicted by the measured magnetic field map, are shown in Figure~\ref{fig:HRRLenergyScan}. Table~\ref{table:HRRLescanFit} list the parameters of a skewed double Gaussian distribution fit.
Media:Beam_Distributions_Beyond_RMS.pdf.
| parameter | Notation | First Gaussian | Second Gaussian |
| amplitude | A | 2.13894 | 10.88318 |
| mean | 12.07181 | 12.32332 | |
| sigma left | 4.46986 | 0.69709 | |
| sigma right | 1.20046 | 0.45170 |
Positron Production Performance
The final year of this work was dedicated to measuring the performance of this linac based positron source. Two NaI detectors were calibrated and installed into the experimental side of the HRRL along with several layers of lead shielding to minimize photon contamination. The performance measurements first focused on establishing the veracity that the detected photons were from positrons annihilating in target T2 by using a permanent magnet to deflect positrons on the accelerator side and then by removing the annihilation target T2. The energy distribution of the the positrons produced using a 10 MeV electron beam was also measured. The results were compared with a simulation of the beam line to reconcile the observed beam loss.
Positron Detection
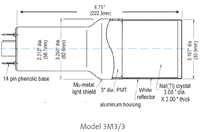
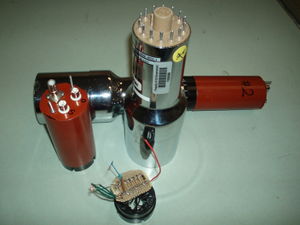
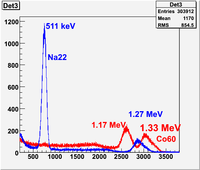
NaI crystals, shown as in the Fig.~\ref{fig:PMT}, were used to detect 511~keV photons emmited by positron annihilating in the target T2. Originally, the detector's output pulse length was around 400~$\mu$s. New PMT bases were constructed to shorten the time of this response to less than 1~$\mu$s. The NaI detector's PMT base was also altered to include both a dynode and an anode output. The crystal attached to these PMTs is a SAINT-GOBAIN CRYSTAL \& DETECTORS (MOD. 3M3/3) NaI crystal with a dimension of $3"\times3"$. The PMT base HV was set to approximately 1150~V. The anode output pulse was summed over a time interval of 2 $\mu$s by a CAEN V792 ADC. The NaI detectors were calibrated using a Na-22 and a Co-60 sources with photon peaks indicated in the Table~\ref{tab:Na22_Co60}. The Fig.~\ref{fig:NaI_Co60_Scope} is the oscilloscope image of Co-60 photon pulses incident on the detector with new PMT. The calibrated NaI detector spectrum of Na-22 and Co-60 sources are shown in the Fig.~\ref{fig:NaI-Calb}. The NaI measurement of the Na-22 511 keV photons has a sigma of about 18 keV.
\begin{figure} \centering \includegraphics[scale=0.4]{3-Apparatus/NaI_Co60_Scope.png} \caption{Pulses of the Co-60 source obtained using new PMT. The amplitude of of the pulse is about 60~mV. The rise time of the pulse is larger than 50 ns, and the fall time is larger than 700~ns.} \label{fig:NaI_Co60_Scope} \end{figure}
\begin{figure} \centering \includegraphics[scale=0.75]{3-Apparatus/Figures/NaI_Calbration/NaI_Calb1.eps} \caption{The calibrated NaI spectrum of Na-22 and Co-60 sources.} \label{fig:NaI-Calb} \end{figure}
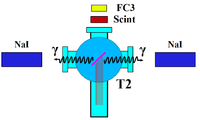
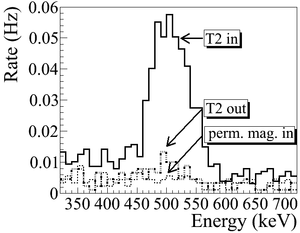
The NaI detectors were installed in the shielded experimental cell as shown in Figure~\ref{fig:app-hrrl-line}. The annihilation target, shown in Figure~\ref{fig:AnnihilationTarget}, intercepted the positron beam causing some of the positrons to annihilate and emit the back-to-back 511 keV photons that characterize the annihilation. Figure~\ref{fig:511peak} represents the photon energy observed by the NaI detectors for three cases. First, a peak in the photon energy spectrum was observed which had an energy consistent with the expected 511 keV annihilation energy. Second, a permanent magnet deflecting positrons on the accelerator side of the experiment cell caused the previously observed 511 keV peak to diminish substantially. The 511 keV signal was also drastically reduced when the annihilation target T2 is removed from the beam line. We argue, based on these results, that the observed signal is predominantly caused by positrons annihilating in the target with very little signal from positrons that are produced by photon pair creation within T2.
| run in: 3735 | 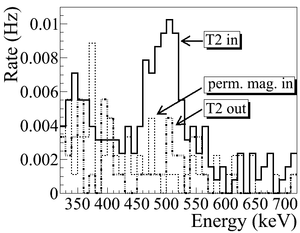
|
|
| Singles spectra for each detector with and without the annihilation target inserted |
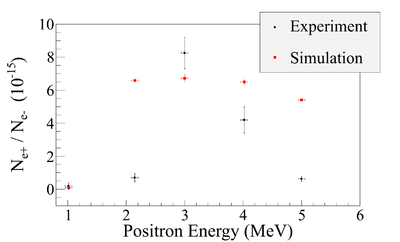
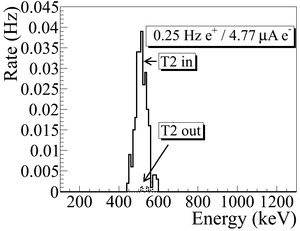
Figure~\ref{fig:511Coinc} represents the positron production rates observed when the characteristic 511 keV photons are measured by both NaI detector in coincidence. Also shown is the rate observed when the annihilation target (T2) is removed from the beam line, indicating an accidental coincidence rate that is negligible. This measurement indicates a that a positron per second was produced using a 19 \muA electron current. The energy dependence of the positron production efficiency was measured by changing the current on dipoles D1 and D2 and is shown in Figure~\ref{fig:e+e-eff}. A simulation was used to estimate the beam loss experienced when transporting positrons from the production target T1. A comparison of the measurements with a beam line simulation appears in Figure~\ref{fig:e+e-eff}.
| run in: 3735 | 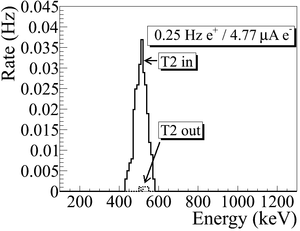
|
|
| Coincidence spectra. |
Things not accomplished
No Positron workshop but rather a PePPO collaboration meeting
Used OTR to measure emmittance.
Positron current was too low for a FC measurement
Positron converter target
 |
|
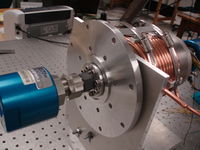
| A picture of the rotating target motor with cooling lines. |
