Difference between revisions of "2NCorr SPDP Introduction"
| (23 intermediate revisions by the same user not shown) | |||
| Line 1: | Line 1: | ||
[[Production Analysis | go_back ]] | [[Production Analysis | go_back ]] | ||
| + | =The calculation of angular correlation= | ||
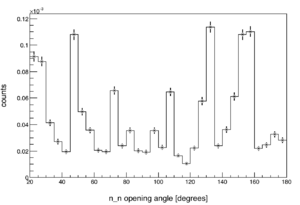
| + | [[File:2N Corr OpeningAngleCf252.png|thumb|300px|right| Unnormalized two-neutron opening angle distribution from the spontaneous fission of Cf252 (E>1.5MeV).]] | ||
| + | |||
| + | The efficiency and acceptance of the neutron detector array varies chaotically over the range of opening angles (see figure to the right). This is in part due to the detector array's non-spherical symmetry, and also to its varying detection efficiency as a function of both particle position and energy. To calculate the acceptance for two neutrons with a given opening angle, one must find every possible way to form | ||
| + | |||
| + | For this reason, in order to produce meaningful results, each distribution must be normalized by a "control" distribution. This normalization is done by diving the values of a distribution by the control distribution on a bin-by-bin basis. A control distribution should be virtually identical to the measured distribution, except that is lacks the correlations of interest, and so all other effects cancel when dividing the two distributions. | ||
| + | |||
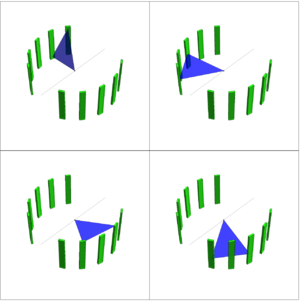
| + | [[File:2NCorrOpeningAnglePhaseSpace.png|thumb|300px|right| This example shows only four out of the many possible ways the detector array can measure an opening angle of 48 degrees. The opening angle acceptance of a given angle depends on all possible ways to configure the angle on the array, and also the intrinsic efficiency of each configuration. Instead of calculating this effect directly, it is removed by normalizing to a control distribution.]] | ||
| + | |||
| + | |||
| + | |||
| + | |||
| + | |||
| + | |||
| − | |||
| − | |||
| − | |||
| − | |||
. | . | ||
==Same pulse and different pulse distributions== | ==Same pulse and different pulse distributions== | ||
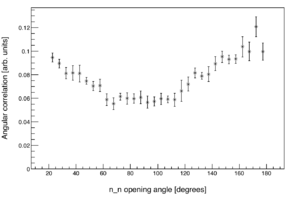
| − | [[File:2n Corr n n CorrelationCf252 1.5MeV.png|thumb|right|300px| Angular correlation in the opening angle between neutron pairs (E>1.5 MeV) from the SF of Cf252. In this case, instead of normalizing with neutrons from separate pulses, neutrons from separate fission | + | [[File:2n Corr n n CorrelationCf252 1.5MeV.png|thumb|right|300px| Angular correlation in the opening angle between neutron pairs (E>1.5 MeV) from the SF of Cf252. In this case, instead of normalizing with neutrons from separate pulses, neutrons from separate fission triggers are used.]] |
| − | The control distribution for two-neutron opening angle (<math>\theta_{nn}</math>) measurements is made by examining neutron events from pairs of two separate pulses. Each pair is chosen such that the two pulses occurred within less than a few 100 ms of each other. This ensures that both pulses were most likely subject to the same experimental conditions, thereby lessening the side effects of time varying factors, such as the | + | The control distribution for two-neutron opening angle (<math>\theta_{nn}</math>) measurements is made by examining neutron events from pairs of two separate pulses. Each pair is chosen such that the two pulses occurred within less than a few 100 ms of each other. This ensures that both pulses were most likely subject to the same experimental conditions, thereby lessening the side effects of time varying factors, such as drift of the high voltage and beam current. With the only restriction for selecting pulse pairs being that they occurred around the same time, as many as 200*n pulse pairs may be selected from a set of n pulses. So, in order to achieve ample statistics, as many pulse pairs as needed are selected. |
Each two pulse pair is analyzed by checking if there are neutron events in both pulses, and if so, the opening angle between the two events is calculated. Since no information can be shared between the neutrons of different pulses, this distribution is free of all two-neutron correlations. On an individual neutron basis, the set of events from same pulses (SP) and different pulses (DP) are indistinguishable, thus both are influenced by detector geometry and efficiency in the exact same way. So barring two-neutron correlations and a scaling factor, the DP distribution is identical to the SP distribution, making it a good choice for the normalizing distribution. | Each two pulse pair is analyzed by checking if there are neutron events in both pulses, and if so, the opening angle between the two events is calculated. Since no information can be shared between the neutrons of different pulses, this distribution is free of all two-neutron correlations. On an individual neutron basis, the set of events from same pulses (SP) and different pulses (DP) are indistinguishable, thus both are influenced by detector geometry and efficiency in the exact same way. So barring two-neutron correlations and a scaling factor, the DP distribution is identical to the SP distribution, making it a good choice for the normalizing distribution. | ||
Throughout this writing, the words "angular correlation" refer to the normalized <math>\theta_{nn}</math> distribution. In other words, it is the <math>\theta_{nn}</math> distribution relative to a completely uncorrelated neutron source, formed by pairing neutron events across separate pulses. The plot to the right shows the same data from the plot above after normalization. | Throughout this writing, the words "angular correlation" refer to the normalized <math>\theta_{nn}</math> distribution. In other words, it is the <math>\theta_{nn}</math> distribution relative to a completely uncorrelated neutron source, formed by pairing neutron events across separate pulses. The plot to the right shows the same data from the plot above after normalization. | ||
| + | |||
| Line 24: | Line 35: | ||
==single-neutron <math>\theta_{abs}</math> and using Cf252 for normalization== | ==single-neutron <math>\theta_{abs}</math> and using Cf252 for normalization== | ||
| − | + | <math>\theta_{abs}</math> is the angle between a neutron and the direction of the incident photon beam. | |
| + | Another measurement possible with this set up is the distribution of <math>\theta_{abs}</math>'s. When normalizing a distribution of neutron singles, the method of using uncorrelated neutron pairs from different pulses no longer works. While the neutrons from separate pulses are uncorrelated with each other, they are both correlated to the direction of the incident photon beam. For this reason, neutron singles from the spontaneous fission (SF) of Cf252 are used for normalization. This choice leads to several issues, because there are big differences in experimental conditions between the measurement of photo-neutrons in the presence of a photon beam, versus the measurement of neutrons from the SF of Cf252. The energy spectrum of neutrons from Cf252 differ from that of our photo-neutrons. During the Cf252 measurement, the detectors experience much dead-time caused by the detection of photons. Also, the noise profiles are very different. Each of these effects must be removed or neglected by employing various corrections and assumptions, which results in a analysis procedure that is less robust than the same-pulse different-pulse method. | ||
=Accidentals and trues= | =Accidentals and trues= | ||
| Line 30: | Line 42: | ||
An accidental neutron coincidence, or ''accidental'' for short, is defined here as any pair of neutrons that are uncorrelated despite having been produced during the same pulse. For example, a neutron from a (gamma,n) reaction paired with a neutron from a (gamma, fiss) reaction. As another example, consider a pulse which causes two photofission events, such that one fission releases four and the other two correlated neutrons, creating 4*2=8 possible distinct pairs of uncorrelated neutrons, or in other words, eight accidentals. | An accidental neutron coincidence, or ''accidental'' for short, is defined here as any pair of neutrons that are uncorrelated despite having been produced during the same pulse. For example, a neutron from a (gamma,n) reaction paired with a neutron from a (gamma, fiss) reaction. As another example, consider a pulse which causes two photofission events, such that one fission releases four and the other two correlated neutrons, creating 4*2=8 possible distinct pairs of uncorrelated neutrons, or in other words, eight accidentals. | ||
| − | A true neutron coincidence, or ''true'' for short, is defined here as any pair correlated neutrons from the same pulse. For example, a photofission event that produces 4 correlated neutrons, creates (4*3)/2=6 trues. | + | A true neutron coincidence, or ''true'' for short, is defined here as any pair correlated neutrons from the same pulse. For example, a photofission event that produces 4 correlated neutrons, creates (4*3)/2=6 trues. Throughout the experiment, measured trues/accidentals always occurred as two-neutron coincidences, as there were never three or more neutrons detected in coincidence. |
| − | |||
| − | Throughout the experiment, measured trues/accidentals always occurred as two-neutron coincidences, as there were never three or more neutrons detected in coincidence. | ||
| − | |||
| − | The detection of accidentals is undesirable, since they are uncorrelated and cannot be told apart from trues. This issue is addressed by using the DP distribution to estimate the accidental distribution, and then subtracting the estimation from the measurement. The two neutrons of an accidental always originate from independent reactions, and so it does not matter whether or not these reactions occurred in the same pulse. Thus, whatever statistical relationship exists between two accidentals in a single pulse, it must be the same for two neutrons taken from separate pulses. It can be shown (see [[Theoretical analysis of 2n accidentals rates|here]]) that the rate of accidentals in SP events is 1/2 of the neutron coincidence rate in DP events. The normalized | + | The detection of accidentals is undesirable, since they are uncorrelated and cannot be told apart from trues. This issue is addressed by using the DP distribution to estimate the accidental distribution, and then subtracting the estimation from the measurement. The two neutrons of an accidental always originate from independent reactions, and so it does not matter whether or not these reactions occurred in the same pulse. Thus, whatever statistical relationship exists between two accidentals in a single pulse, it must be the same for two neutrons taken from separate pulses. It can be shown (see [[Theoretical analysis of 2n accidentals rates|here]]) that the rate of accidentals in SP events is 1/2 of the neutron coincidence rate in DP events. The accidental subtracted, normalized two-neutron opening angle distribution, <math>\Theta_{nn}</math>, is given by: |
:<math>\Theta_{nn} = \frac{SP-A}{DP}</math> | :<math>\Theta_{nn} = \frac{SP-A}{DP}</math> | ||
::where | ::where | ||
| − | ::<math>SP</math> is the measured opening angle distribution from same pulse events, which is the sum trues, accidentals, and noise. | + | ::<math>SP</math> is the measured opening angle distribution from same pulse events, which is the sum of trues, accidentals, and noise. |
::<math>A</math> is the opening angle distribution of accidentals from same pulse events, which cannot be measured directly. | ::<math>A</math> is the opening angle distribution of accidentals from same pulse events, which cannot be measured directly. | ||
| − | ::<math>DP</math> is the opening angle distribution from different pulse events. | + | ::<math>DP</math> is the opening angle distribution taken from different pulse events. |
| − | While | + | While the opening angle distribution of accidentals is not known, it can be estimated by <math>A\approx0.5*DP</math>, giving: |
:<math>\Theta_{nn} = \frac{SP-\frac{1}{2}DP}{DP}</math> | :<math>\Theta_{nn} = \frac{SP-\frac{1}{2}DP}{DP}</math> | ||
Latest revision as of 00:22, 24 January 2018
The calculation of angular correlation
The efficiency and acceptance of the neutron detector array varies chaotically over the range of opening angles (see figure to the right). This is in part due to the detector array's non-spherical symmetry, and also to its varying detection efficiency as a function of both particle position and energy. To calculate the acceptance for two neutrons with a given opening angle, one must find every possible way to form
For this reason, in order to produce meaningful results, each distribution must be normalized by a "control" distribution. This normalization is done by diving the values of a distribution by the control distribution on a bin-by-bin basis. A control distribution should be virtually identical to the measured distribution, except that is lacks the correlations of interest, and so all other effects cancel when dividing the two distributions.

.
Same pulse and different pulse distributions
The control distribution for two-neutron opening angle () measurements is made by examining neutron events from pairs of two separate pulses. Each pair is chosen such that the two pulses occurred within less than a few 100 ms of each other. This ensures that both pulses were most likely subject to the same experimental conditions, thereby lessening the side effects of time varying factors, such as drift of the high voltage and beam current. With the only restriction for selecting pulse pairs being that they occurred around the same time, as many as 200*n pulse pairs may be selected from a set of n pulses. So, in order to achieve ample statistics, as many pulse pairs as needed are selected.
Each two pulse pair is analyzed by checking if there are neutron events in both pulses, and if so, the opening angle between the two events is calculated. Since no information can be shared between the neutrons of different pulses, this distribution is free of all two-neutron correlations. On an individual neutron basis, the set of events from same pulses (SP) and different pulses (DP) are indistinguishable, thus both are influenced by detector geometry and efficiency in the exact same way. So barring two-neutron correlations and a scaling factor, the DP distribution is identical to the SP distribution, making it a good choice for the normalizing distribution.
Throughout this writing, the words "angular correlation" refer to the normalized distribution. In other words, it is the distribution relative to a completely uncorrelated neutron source, formed by pairing neutron events across separate pulses. The plot to the right shows the same data from the plot above after normalization.
.
single-neutron and using Cf252 for normalization
is the angle between a neutron and the direction of the incident photon beam. Another measurement possible with this set up is the distribution of 's. When normalizing a distribution of neutron singles, the method of using uncorrelated neutron pairs from different pulses no longer works. While the neutrons from separate pulses are uncorrelated with each other, they are both correlated to the direction of the incident photon beam. For this reason, neutron singles from the spontaneous fission (SF) of Cf252 are used for normalization. This choice leads to several issues, because there are big differences in experimental conditions between the measurement of photo-neutrons in the presence of a photon beam, versus the measurement of neutrons from the SF of Cf252. The energy spectrum of neutrons from Cf252 differ from that of our photo-neutrons. During the Cf252 measurement, the detectors experience much dead-time caused by the detection of photons. Also, the noise profiles are very different. Each of these effects must be removed or neglected by employing various corrections and assumptions, which results in a analysis procedure that is less robust than the same-pulse different-pulse method.
Accidentals and trues
An accidental neutron coincidence, or accidental for short, is defined here as any pair of neutrons that are uncorrelated despite having been produced during the same pulse. For example, a neutron from a (gamma,n) reaction paired with a neutron from a (gamma, fiss) reaction. As another example, consider a pulse which causes two photofission events, such that one fission releases four and the other two correlated neutrons, creating 4*2=8 possible distinct pairs of uncorrelated neutrons, or in other words, eight accidentals.
A true neutron coincidence, or true for short, is defined here as any pair correlated neutrons from the same pulse. For example, a photofission event that produces 4 correlated neutrons, creates (4*3)/2=6 trues. Throughout the experiment, measured trues/accidentals always occurred as two-neutron coincidences, as there were never three or more neutrons detected in coincidence.
The detection of accidentals is undesirable, since they are uncorrelated and cannot be told apart from trues. This issue is addressed by using the DP distribution to estimate the accidental distribution, and then subtracting the estimation from the measurement. The two neutrons of an accidental always originate from independent reactions, and so it does not matter whether or not these reactions occurred in the same pulse. Thus, whatever statistical relationship exists between two accidentals in a single pulse, it must be the same for two neutrons taken from separate pulses. It can be shown (see here) that the rate of accidentals in SP events is 1/2 of the neutron coincidence rate in DP events. The accidental subtracted, normalized two-neutron opening angle distribution, , is given by:
-
- where
- is the measured opening angle distribution from same pulse events, which is the sum of trues, accidentals, and noise.
- is the opening angle distribution of accidentals from same pulse events, which cannot be measured directly.
- is the opening angle distribution taken from different pulse events.
While the opening angle distribution of accidentals is not known, it can be estimated by , giving:

