Difference between revisions of "LB GEMC2.4CJ2.4 Vertex"
| (24 intermediate revisions by the same user not shown) | |||
| Line 14: | Line 14: | ||
~/src/CLAS/coatjava-2.4/bin/clas12-reconstruction -i eg12_nosol_75k_noLUND.ev -config GEOM::new=true -config MAG::torus=-1.0 -config MAG::solenoid=1.0 -o temp.evio -s DCHB:DCTB:EC:FTOF:EB -config DATA::mc=true | ~/src/CLAS/coatjava-2.4/bin/clas12-reconstruction -i eg12_nosol_75k_noLUND.ev -config GEOM::new=true -config MAG::torus=-1.0 -config MAG::solenoid=1.0 -o temp.evio -s DCHB:DCTB:EC:FTOF:EB -config DATA::mc=true | ||
| + | |||
| + | ===How to Use run.exe=== | ||
| + | |||
| + | I have created a program on lds2 called "run.exe" which will run GEMC simulations, reconstruct them, create ROOT files, and plot histograms of the generated vertex positions, the reconstructed vertex positions and the difference between the two. To use this, simply enter | ||
| + | |||
| + | tcsh | ||
| + | |||
| + | source ~/src/CLAS/GEMC/setup | ||
| + | |||
| + | then go to /home/src/CLAS/GEMC/experiments/eg12/vertex | ||
| + | |||
| + | then use ./run.exe | ||
==Sweet spot== | ==Sweet spot== | ||
| Line 141: | Line 153: | ||
[[File:ThetaDifferenceZRasterSol.png | 200px]] | [[File:ThetaDifferenceZRasterSol.png | 200px]] | ||
[[File:PhiDifferenceZrasterSol.png | 200px]] | [[File:PhiDifferenceZrasterSol.png | 200px]] | ||
| + | |||
| + | For the plots below I used a target with generated Z vertex positions ranging form -3cm to 3cm. The plot is shown below: | ||
| + | |||
| + | [[File:3cm_ZRaster_LUND_sol_75k.png|200px]] | ||
| + | |||
| + | Below are the reconstructed Z vertex positions plotted on a log scale to show that some outliers exist | ||
| + | |||
| + | [[File:3cm ZRaster EventZ sol 75k.png|200px]] | ||
| + | |||
| + | Finally the difference between the reconstructed and the generated Z vertex positions are plotted: | ||
| + | |||
| + | [[File:3cm ZRaster VZDifference sol 75k.png|200px]] | ||
==Raster in X == | ==Raster in X == | ||
| + | |||
| + | I simulated 75000 6GeV electron events fired at 25 degrees in theta and 0 degrees in phi with GEMC 2.4 and used an evio to root program to convert the reconstructed data to a root file. In the input LUND file for GEMC, I set the x vertex to raster by +/- 1cm. Vy and Vz were set to be generated at 0. Below is a plot of the generated x vertices in centimeters: | ||
| + | |||
| + | [[File:1cm XRaster GenPartX sol.png |200px]] | ||
| + | |||
| + | |||
| + | The reconstructed events were put on a log scale to show that there were some large outlying values, but those were removed when the difference was taken. The plot below also has its x reconstructed vertices in centimeters. | ||
| + | |||
| + | [[File:1cm XRaster EventX 75k sol.png|200px]] | ||
| + | |||
| + | Finally the difference was take between these two values restricting that the reconstructed vertices are +/- 2cm. | ||
| + | |||
| + | |||
| + | [[File:1cm XRaster VxDifference sol 75k.png|200px]] | ||
| + | |||
| + | The RMS, which gives the resolution can be seen to be 0.3427cm. | ||
==Raster in Y == | ==Raster in Y == | ||
| + | I simulated 75000 6GeV electron events fired at 25 degrees in theta and 0 degrees in phi with GEMC 2.4 and used an evio to root program to convert the reconstructed data to a root file. In the input LUND file for GEMC, I set the y vertex to raster by +/- 1cm. Vx and Vz were set to be generated at 0. Below is a plot of the generated y vertices in centimeters: | ||
| + | |||
| + | [[File:1cm YRaster GenPartY 75k sol.png|200px]] | ||
| + | |||
| + | |||
| + | The reconstructed events were put on a log scale to show that there were some large outlying values, but those were removed when the difference was taken. The plot below also has its y reconstructed vertices in centimeters. | ||
| + | |||
| + | [[File:1cm YRaster EventY 75k sol.png|200px]] | ||
| + | |||
| + | Finally the difference was take between these two values restricting that the reconstructed vertices are +/- 2cm. | ||
| + | |||
| + | [[File:1cm YRaster VyDifference 75k sol.png|200px]] | ||
| + | |||
| + | It can be seen that the resolution is 0.3373cm | ||
== Raster in X & Y Zis zero == | == Raster in X & Y Zis zero == | ||
| Line 208: | Line 262: | ||
[[File:PhiDifferenceXYZRasterSol.png | 200px]] | [[File:PhiDifferenceXYZRasterSol.png | 200px]] | ||
| + | For the following plots I used a LUND file that generated a spread of X and Y vertices from -1cm to 1cm and Z vertices from -3cm to 3cm. Below are the plots for the generated X,Y, and Z vertices: | ||
| + | |||
| + | Generated X Vertices: | ||
| + | |||
| + | [[File:3cm ZRaster 1cm XYRaster sol GenPartx.png|200px]] | ||
| + | |||
| + | Generated Y Vertices: | ||
| + | |||
| + | [[File:3cm ZRaster 1cm XYRaster GenParty.png|200px]] | ||
| + | |||
| + | Generated Z Vertices: | ||
| + | |||
| + | [[File:3cm ZRaster 1cm XYRaster GenPartz sol.png|200px]] | ||
| + | |||
| + | and below are the reconstructed X,Y, and Z vertices plotted on a log scale to show that some outliers do exist: | ||
| + | |||
| + | Reconstructed X Vertices: | ||
| + | |||
| + | [[File:3cm ZRaster 1cm XYRaster Eventx.png|200px]] | ||
| + | |||
| + | Reconstructed Y Vertices: | ||
| + | |||
| + | [[File:3cm ZRaster 1cm XYRaster Eventy.png|200px]] | ||
| + | |||
| + | Reconstructed Z Vertices: | ||
| + | |||
| + | [[File:3cm ZRaster 1cm XYRaster eventz.png|200px]] | ||
| + | |||
| + | and finally below are the differences between the generated and the reconstructed vertex positions: | ||
| + | |||
| + | X Difference: | ||
| + | |||
| + | [[File:3cm ZRaster 1cm XYRaster VxDifference.png|200px]] | ||
| + | |||
| + | Y Difference: | ||
| + | |||
| + | [[File:3cm ZRaster 1cm XYRaster VyDifference.png|200px]] | ||
| + | |||
| + | Z Difference: | ||
| + | |||
| + | [[File:3cm ZRaster 1cm XYRaster VzDifference.png|200px]] | ||
=Electron Vertex reconstruction= | =Electron Vertex reconstruction= | ||
Latest revision as of 15:45, 23 July 2016
Reconstruction Efficiencies
Simulation commands
Solenoid Off
~/src/CLAS/GEMC/source/gemc -USE_GUI=0 -SPREAD_V="(0.1, 10)cm" -N=100 eg12_nosol_noLUND.gcard
~/src/CLAS/coatjava-2.4/bin/clas12-reconstruction -i eg12_nosol_75k_noLUND.ev -config GEOM::new=true -config MAG::torus=-1.0 -config MAG::solenoid=0.0 -o temp.evio -s DCHB:DCTB:EC:FTOF:EB -config DATA::mc=true
Solenoid On
~/src/CLAS/GEMC/source/gemc -USE_GUI=0 -SPREAD_V="(0.1, 10)cm" -N=100 eg12_sol_noLUND.gcard
~/src/CLAS/coatjava-2.4/bin/clas12-reconstruction -i eg12_nosol_75k_noLUND.ev -config GEOM::new=true -config MAG::torus=-1.0 -config MAG::solenoid=1.0 -o temp.evio -s DCHB:DCTB:EC:FTOF:EB -config DATA::mc=true
How to Use run.exe
I have created a program on lds2 called "run.exe" which will run GEMC simulations, reconstruct them, create ROOT files, and plot histograms of the generated vertex positions, the reconstructed vertex positions and the difference between the two. To use this, simply enter
tcsh
source ~/src/CLAS/GEMC/setup
then go to /home/src/CLAS/GEMC/experiments/eg12/vertex
then use ./run.exe
Sweet spot
TS_RunGroupC#Sweet_spot Below is the command line I used for GEMC
gemc -USE_GUI=0 -HALL_MATERIAL="Vacuum" , -N=75000 eg12_nosol1.gcard
Here is the gcard
<gcard>
      <detector name="../../../../clas12/fc/forwardCarriage" factory="TEXT" variation="original"/>
      <detector name="../../../../clas12/dc/dc"            factory="TEXT" variation="original"/>
      <detector name="../../../../clas12/ec/ec"            factory="TEXT" variation="original"/>
      <detector name="../../../../clas12/ctof/ctof"            factory="TEXT" variation="original"/>
      <detector name="../../../../clas12/ftof/ftof"            factory="TEXT" variation="original"/>
      <detector name="../../../../clas12/htcc/htcc"            factory="TEXT" variation="original"/>
      <detector name="../../../../clas12/pcal/pcal"            factory="TEXT" variation="javageom"/>
      <option name="SCALE_FIELD" value="clas12-torus-big, -1"/>
     <option name="OUTPUT" value="evio,eg12_nosol_1.ev"/>
     <option name="BEAM_P" value="e-, 6.0*GeV, 25.0*deg, 0*deg"/>
     <option name="SPREAD_P" value="4.0*GeV, 0*deg, 0*deg"/>
</gcard>
Here is the reconstruction command
~/src/CLAS/coatjava-1.0/bin/clas12-reconstruction -s FMT:DCHB:DCTB:FTOF:EC:EB -config DCTB::useRaster=true -config MAG::solenoid=0 -i eg12_nosol_1.ev -o eg12_nosol_1_rec.ev
Below is the command and the gcard used for when the solenoid was on
gemc -USE_GUI=0 -HALL_MATERIAL="Vacuum" , -N=100000 eg12_sol1.gcard
<gcard>
       <detector name="../../../../../clas12/fc/forwardCarriage" factory="TEXT" variation="original"/>
       <detector name="../../../../../clas12/dc/dc"            factory="TEXT" variation="original"/>
       <detector name="../../../../../clas12/ec/ec"            factory="TEXT" variation="original"/>
       <detector name="../../../../../clas12/ctof/ctof"            factory="TEXT" variation="original"/>
       <detector name="../../../../../clas12/ftof/ftof"            factory="TEXT" variation="original"/>
       <detector name="../../../../../clas12/htcc/htcc"            factory="TEXT" variation="original"/>
       <detector name="../../../../../clas12/pcal/pcal"            factory="TEXT" variation="javageom"/>
       <option name="SCALE_FIELD" value="clas12-torus-big, -1"/>
       <option name="HALL_FIELD"  value="clas12-solenoid"/>
       <option name="OUTPUT" value="evio,eg12_sol_1.ev"/>
       <option name="BEAM_P" value="e-, 6.0*GeV, 25.0*deg, 0*deg"/>
       <option name="SPREAD_P" value="4.0*GeV, 0*deg, 0*deg"/>
</gcard>
~/src/CLAS/coatjava-1.0/bin/clas12-reconstruction -s FMT:DCHB:DCTB:FTOF:EC:EB -config MAG::fields=nominal -config DATA::mc=true -i eg12_sol_1.ev -o eg12_sol_1_rec.evio
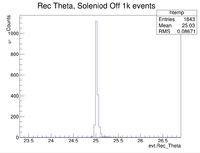
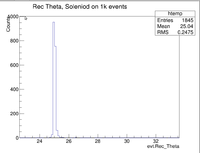
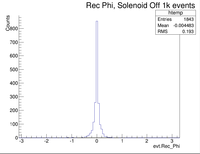
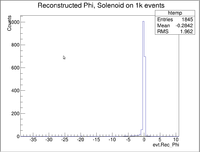
Below are the reconstructed events with the solenoid on and off for 1k events
Raster in Z
Since the LUND files are not currently operating correctly, I will use a different method to raster in Z. I will use the GEMC command line to reduce the radius of the target to 0 cm and randomly place vertex positions along Z (like a line target). The command line for GEMC is shown below along with the gcard when the solenoid is off:
~/src/CLAS/GEMC/source/gemc -USE_GUI=0 -SPREAD_V="(0.0, 3)cm" -N=100 eg12_nosol_noLUND.gcard
<gcard>
      <detector name="../../clas12/fc/forwardCarriage" factory="TEXT" variation="original"/>
      <detector name="../../clas12/dc/dc"            factory="TEXT" variation="ccdb"/>
      <detector name="../../clas12/ec/ec"            factory="TEXT" variation="original"/>
      <detector name="../../clas12/ctof/ctof"            factory="TEXT" variation="original"/>
      <detector name="../../clas12/ftof/ftof"            factory="TEXT" variation="java"/>
      <detector name="../../clas12/htcc/htcc"            factory="TEXT" variation="original"/>
      <detector name="../../clas12/pcal/pcal"            factory="TEXT" variation="javageom"/>
      <option name="SCALE_FIELD" value="clas12-torus-big, -1"/>
     <option name="OUTPUT" value="evio,eg12_nosol_75k_noLUND.ev"/>
     <option name="BEAM_P" value="e-, 6.0*GeV, 25.0*deg, 0*deg"/>
     <option name="SPREAD_P" value="4.0*GeV, 0*deg, 0*deg"/>
</gcard>
and here is the reconstruction command line ~/src/CLAS/coatjava-2.4/bin/clas12-reconstruction -i eg12_nosol_75k_noLUND.ev -config GEOM::new=true -config MAG::torus=-1.0 -config MAG::solenoid=0.0 -o eg12_nosol_75k_noLUND_rec.ev -s DCHB:DCTB:EC:FTOF:EB -config DATA::mc=true
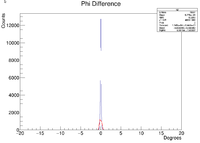
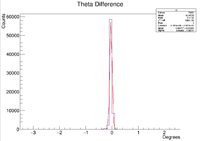
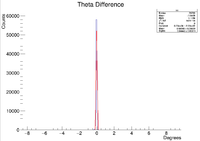
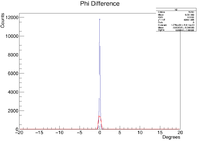
Below are the differences between the generated and reconstructed angles for 75k events:
Below are the command lines and gcard used for GEMC and the reconstruction software when the solenoid is on
~/src/CLAS/GEMC/source/gemc -USE_GUI=0 -SPREAD_V="(0.0, 3)cm" -N=75000 eg12_sol_noLUND.gcard
~/src/CLAS/coatjava-2.4/bin/clas12-reconstruction -i eg12_sol_75k_noLUND_3cm_Zraster.ev -config GEOM::new=true -config MAG::torus=-1.0 -config MAG::solenoid=1.0 -o eg12_sol_75k_noLUND_3cm_Zraster_rec.evio -s DCHB:DCTB:EC:FTOF:EB -config DATA::mc=true
<gcard>
      <detector name="../../../clas12/fc/forwardCarriage" factory="TEXT" variation="original"/>
      <detector name="../../../clas12/dc/dc"            factory="TEXT" variation="ccdb"/>
      <detector name="../../../clas12/ec/ec"            factory="TEXT" variation="original"/>
      <detector name="../../../clas12/ctof/ctof"            factory="TEXT" variation="original"/>
      <detector name="../../../clas12/ftof/ftof"            factory="TEXT" variation="java"/>
      <detector name="../../../clas12/htcc/htcc"            factory="TEXT" variation="original"/>
      <detector name="../../../clas12/pcal/pcal"            factory="TEXT" variation="javageom"/>
      <option name="SCALE_FIELD" value="clas12-torus-big, -1"/>
      <option name="HALL_FIELD"  value="clas12-solenoid"/>
      <option name="OUTPUT" value="evio,eg12_sol_75k_noLUND_3cm_Zraster.ev"/>
      <option name="BEAM_P" value="e-, 6.0*GeV, 25.0*deg, 0*deg"/>
      <option name="SPREAD_P" value="4.0*GeV, 0*deg, 0*deg"/>
</gcard>
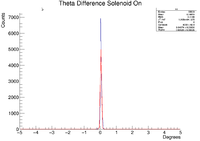
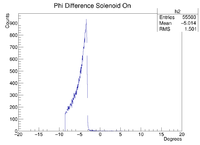
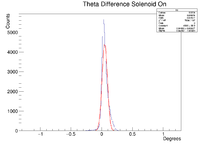
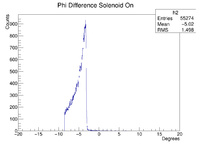
Below are the plots for the differences between the generated and the reconstructed values for theta and phi with the solenoid on for 75k events:
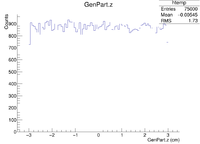
For the plots below I used a target with generated Z vertex positions ranging form -3cm to 3cm. The plot is shown below:
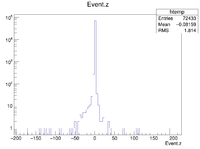
Below are the reconstructed Z vertex positions plotted on a log scale to show that some outliers exist
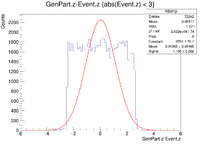
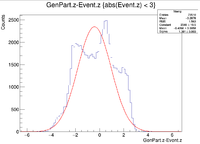
Finally the difference between the reconstructed and the generated Z vertex positions are plotted:
Raster in X
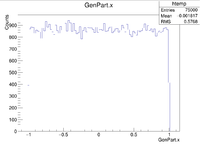
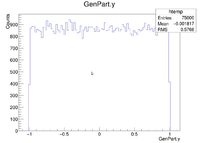
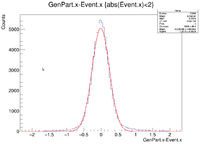
I simulated 75000 6GeV electron events fired at 25 degrees in theta and 0 degrees in phi with GEMC 2.4 and used an evio to root program to convert the reconstructed data to a root file. In the input LUND file for GEMC, I set the x vertex to raster by +/- 1cm. Vy and Vz were set to be generated at 0. Below is a plot of the generated x vertices in centimeters:
The reconstructed events were put on a log scale to show that there were some large outlying values, but those were removed when the difference was taken. The plot below also has its x reconstructed vertices in centimeters.
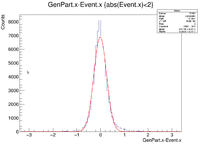
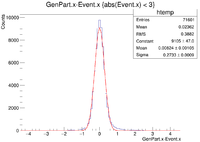
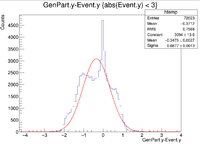
Finally the difference was take between these two values restricting that the reconstructed vertices are +/- 2cm.
The RMS, which gives the resolution can be seen to be 0.3427cm.
Raster in Y
I simulated 75000 6GeV electron events fired at 25 degrees in theta and 0 degrees in phi with GEMC 2.4 and used an evio to root program to convert the reconstructed data to a root file. In the input LUND file for GEMC, I set the y vertex to raster by +/- 1cm. Vx and Vz were set to be generated at 0. Below is a plot of the generated y vertices in centimeters:
The reconstructed events were put on a log scale to show that there were some large outlying values, but those were removed when the difference was taken. The plot below also has its y reconstructed vertices in centimeters.
Finally the difference was take between these two values restricting that the reconstructed vertices are +/- 2cm.
It can be seen that the resolution is 0.3373cm
Raster in X & Y Zis zero
Below is the command line used for rastering in X and Y while leaving the z-component of the vertex at 0 with the solenoid off:
~/src/CLAS/GEMC/source/gemc -USE_GUI=0 -SPREAD_V="(0.5, 0)cm" -N=75000 eg12_nosol_noLUND.gcard
and here is the reconstruction command line
~/src/CLAS/coatjava-2.4/bin/clas12-reconstruction -i eg12_nosol_75k_noLUND_xyraster.ev -config GEOM::new=true -config MAG::torus=-1.0 -config MAG::solenoid=0.0 -o eg12_nosol_75k_noLUND_xyraster_rec.evio -s DCHB:DCTB:EC:FTOF:EB -config DATA::mc=true
Below are the differences between the reconstructed and the generated angles for rastering 1cm in XY:
Below are the command lines and the gcard used for when the solenoid was on:
~/src/CLAS/GEMC/source/gemc -USE_GUI=0 -SPREAD_V="(0.5, 0)cm" -N=75000 eg12_sol_noLUND.gcard
~/src/CLAS/coatjava-2.4/bin/clas12-reconstruction -i eg12_sol_75k_noLUND_1cm_XYraster.ev -config GEOM::new=true -config MAG::torus=-1.0 -config MAG::solenoid=1.0 -o eg12_sol_75k_noLUND_1cm_XYraster_rec.evio -s DCHB:DCTB:EC:FTOF:EB -config DATA::mc=true
<gcard>
      <detector name="../../../../clas12/fc/forwardCarriage" factory="TEXT" variation="original"/>
      <detector name="../../../../clas12/dc/dc"            factory="TEXT" variation="ccdb"/>
      <detector name="../../../../clas12/ec/ec"            factory="TEXT" variation="original"/>
      <detector name="../../../../clas12/ctof/ctof"            factory="TEXT" variation="original"/>
      <detector name="../../../../clas12/ftof/ftof"            factory="TEXT" variation="java"/>
      <detector name="../../../../clas12/htcc/htcc"            factory="TEXT" variation="original"/>
      <detector name="../../../../clas12/pcal/pcal"            factory="TEXT" variation="javageom"/>
      <option name="SCALE_FIELD" value="clas12-torus-big, -1"/>
      <option name="HALL_FIELD"  value="clas12-solenoid"/>
      <option name="OUTPUT" value="evio,eg12_sol_75k_noLUND_1cm_XYraster.ev"/>
      <option name="BEAM_P" value="e-, 6.0*GeV, 25.0*deg, 0*deg"/>
      <option name="SPREAD_P" value="4.0*GeV, 0*deg, 0*deg"/>
</gcard>
Here are the plots for the differences in the generated and reconstructed values for theta and phi with the solenoid on:
Raster in XYZ
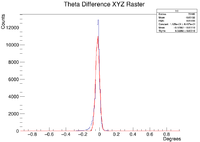
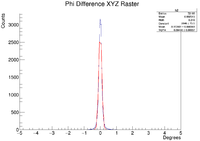
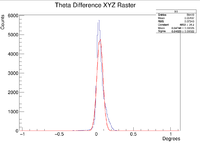
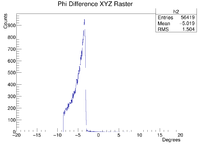
For this simulation I rastered the beam in the XY plane around 1cm, and z was rastered +/- 3cm. Below are the differences in the the generated and reconstructed angles for when the solenoid was off:
and here are the plots for when the solenoid was on:
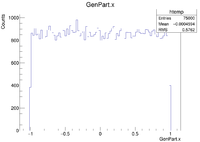
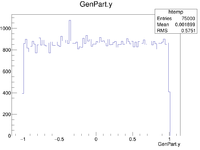
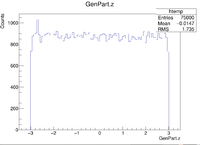
For the following plots I used a LUND file that generated a spread of X and Y vertices from -1cm to 1cm and Z vertices from -3cm to 3cm. Below are the plots for the generated X,Y, and Z vertices:
Generated X Vertices:
Generated Y Vertices:
Generated Z Vertices:
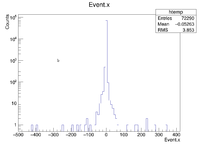
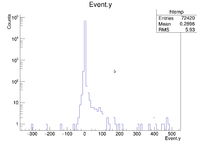
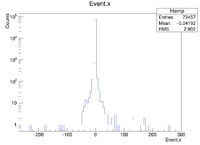
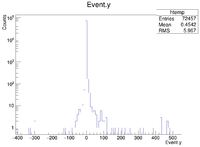
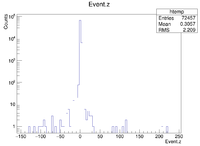
and below are the reconstructed X,Y, and Z vertices plotted on a log scale to show that some outliers do exist:
Reconstructed X Vertices:
Reconstructed Y Vertices:
Reconstructed Z Vertices:
and finally below are the differences between the generated and the reconstructed vertex positions:
X Difference:
Y Difference:
Z Difference:
Electron Vertex reconstruction
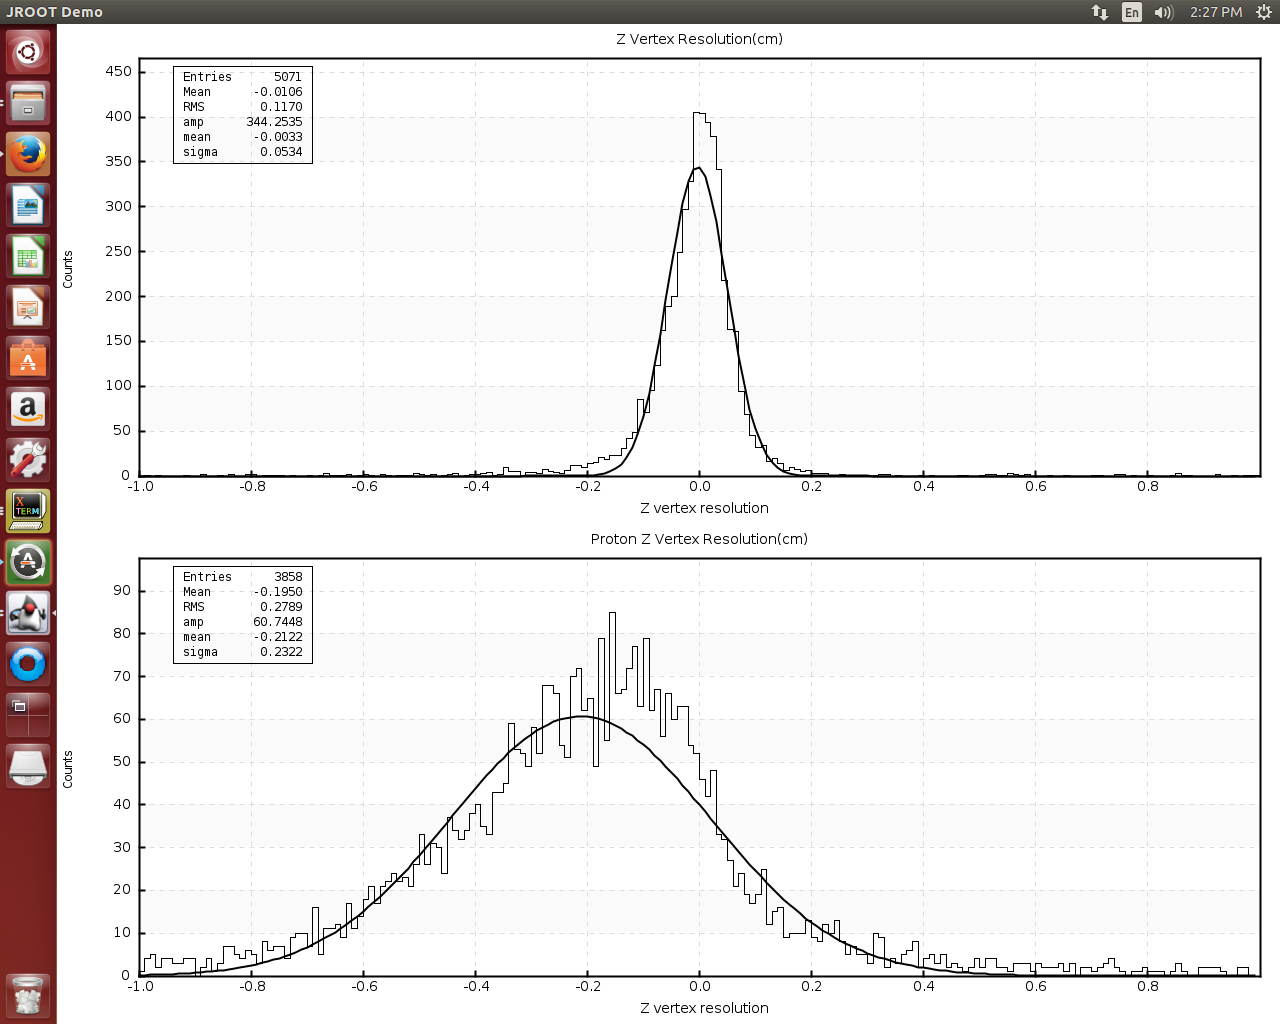
I have created histograms of the z-vertex resolutions for both the proton and the electron using elastic events from the origin. I used the gemc command line to output a file called eg12_lb_NoSol.ev
gemc -USE_GUI=0 -INPUT_GEN_FILE="LUND, ElasticEvents_FromOrigin.LUND" -N=75000 eg12.gcard
My gcard looks like this
      <detector name="../../../../clas12/fc/forwardCarriage" factory="TEXT" variation="original"/>
      <detector name="../../../../clas12/dc/dc"            factory="TEXT" variation="original"/>
      <detector name="../../../../clas12/ec/ec"            factory="TEXT" variation="original"/>
      <detector name="../../../../clas12/ctof/ctof"            factory="TEXT" variation="original"/>
      <detector name="../../../../clas12/ftof/ftof"            factory="TEXT" variation="original"/>
      <detector name="../../../../clas12/htcc/htcc"            factory="TEXT" variation="original"/>
       <detector name="../../../clas12/pcal/pcal"            factory="TEXT" variation="original"/>
      <option name="SCALE_FIELD" value="clas12-torus-big, -1"/>
     <option name="OUTPUT" value="evio,eg12_lb_NoSol.ev"/>
then I ran the reconstruction program using
~/src/CLAS/coatjava/bin/clas12-reconstruction -s FMT:DCHB:DCTB:FTOF:EC:EB -config DCTB::useRaster=true -config MAG::solenoid=0 -i eg12_lb_NoSol.ev -o eg12_lb_NoSol_rec.ev
After that I used the eg12_lb_NoSol_rec.ev to create the histograms
Here are the histograms when the solenoid is off
Then I ran the GEMC simulation with the solenoid on. My gcard was
<gcard>
      <detector name="../../clas12/fc/forwardCarriage" factory="TEXT" variation="original"/>
      <detector name="../../clas12/dc/dc"            factory="TEXT" variation="original"/>
      <detector name="../../clas12/ec/ec"            factory="TEXT" variation="original"/>
      <detector name="../../clas12/ctof/ctof"            factory="TEXT" variation="original"/>
      <detector name="../../clas12/ftof/ftof"            factory="TEXT" variation="original"/>
      <detector name="../../clas12/htcc/htcc"            factory="TEXT" variation="original"/>
      <detector name="../../clas12/pcal/pcal"            factory="TEXT" variation="original"/>
      <option name="SCALE_FIELD" value="clas12-torus-big, -1"/>
      <option name="HALL_FIELD"  value="clas12-solenoid"/>
     <option name="OUTPUT" value="evio, eg12_lb_Sol.ev"/>
</gcard>
Which gives the output file eg12_lb_Sol.ev. I used the GEMC command line
gemc -USE_GUI=0 -INPUT_GEN_FILE="LUND, ElasticEvents_FromOrigin.LUND" -N=75000 eg12_Sol.gcard
Then I made the reconstructed file, eg12_lb_Sol_rec.ev using the command line
~/src/CLAS/coatjava//bin/clas12-reconstruction -s FMT:DCHB:DCTB:FTOF:EC:EB -config MAG::fields=nominal -i eg12_Sol.ev -o eg12_lb_Sol_rec.ev
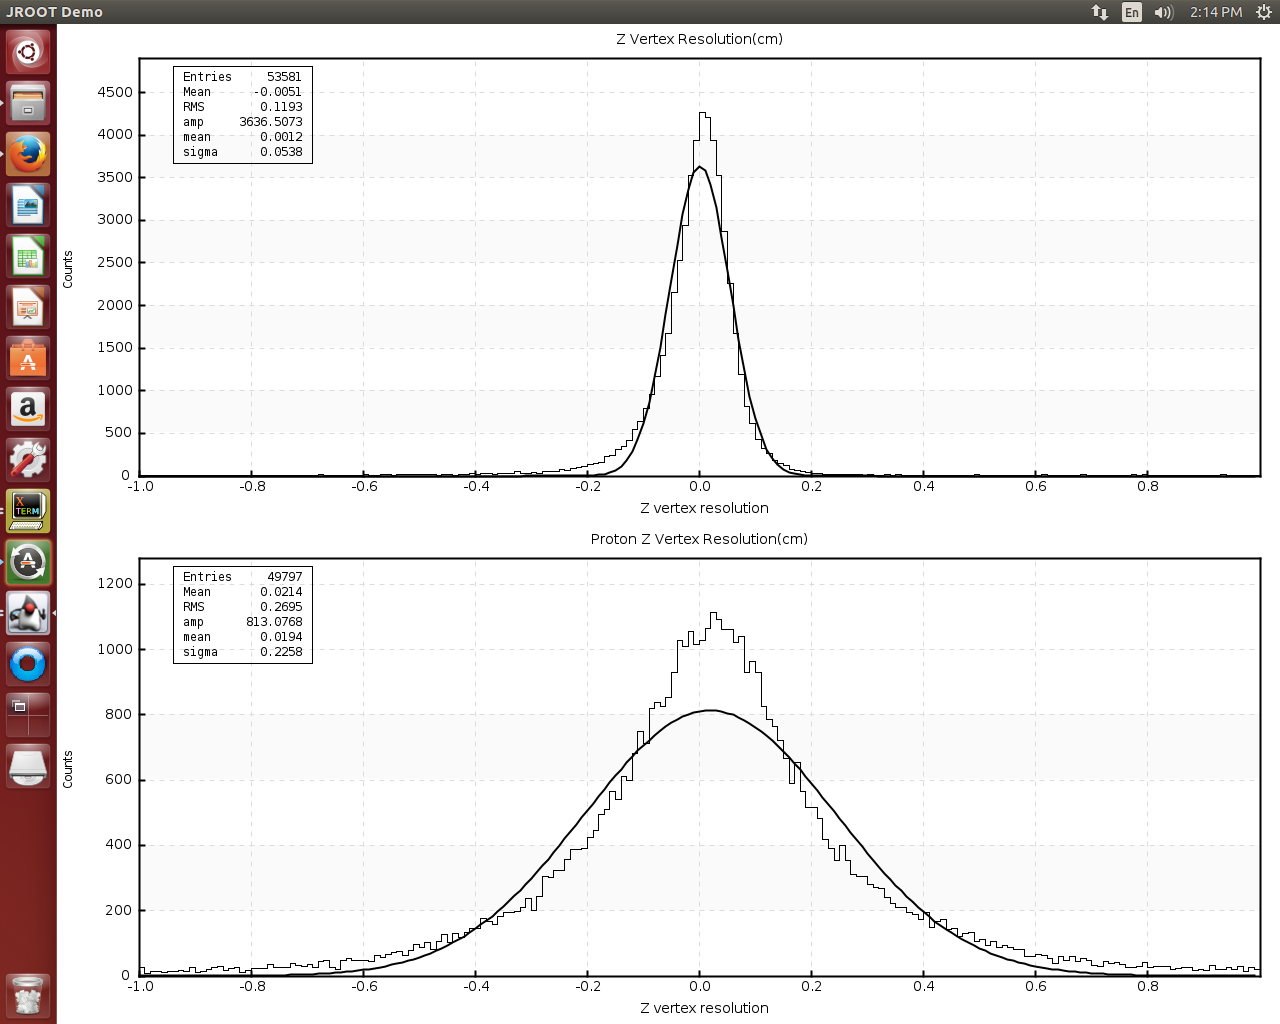
The histogram is below
Now I will get more simulated events and use the java geometry for the pcal and the LUND file Vertex0.075k_10-40.dat and investigate the Z vertex resolution using different radius cuts.
