Difference between revisions of "LB GEMC2.4CJ2.4 Vertex"
| Line 250: | Line 250: | ||
[[File:PhiDifferenceXYZRasterSol.png | 200px]] | [[File:PhiDifferenceXYZRasterSol.png | 200px]] | ||
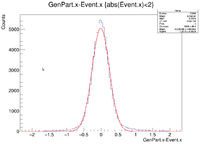
| + | For the following plots I used a LUND file that generated a spread of X and Y vertices from -1cm to 1cm and Z vertices from -3cm to 3cm. Below are the plots for the generated X,Y, and Z vertices: | ||
| + | |||
| + | [[File:3cm ZRaster 1cm XYRaster sol GenPartx.png|200px]] | ||
=Electron Vertex reconstruction= | =Electron Vertex reconstruction= | ||
Revision as of 19:10, 5 July 2016
Reconstruction Efficiencies
Simulation commands
Solenoid Off
~/src/CLAS/GEMC/source/gemc -USE_GUI=0 -SPREAD_V="(0.1, 10)cm" -N=100 eg12_nosol_noLUND.gcard
~/src/CLAS/coatjava-2.4/bin/clas12-reconstruction -i eg12_nosol_75k_noLUND.ev -config GEOM::new=true -config MAG::torus=-1.0 -config MAG::solenoid=0.0 -o temp.evio -s DCHB:DCTB:EC:FTOF:EB -config DATA::mc=true
Solenoid On
~/src/CLAS/GEMC/source/gemc -USE_GUI=0 -SPREAD_V="(0.1, 10)cm" -N=100 eg12_sol_noLUND.gcard
~/src/CLAS/coatjava-2.4/bin/clas12-reconstruction -i eg12_nosol_75k_noLUND.ev -config GEOM::new=true -config MAG::torus=-1.0 -config MAG::solenoid=1.0 -o temp.evio -s DCHB:DCTB:EC:FTOF:EB -config DATA::mc=true
Sweet spot
TS_RunGroupC#Sweet_spot Below is the command line I used for GEMC
gemc -USE_GUI=0 -HALL_MATERIAL="Vacuum" , -N=75000 eg12_nosol1.gcard
Here is the gcard
<gcard>
      <detector name="../../../../clas12/fc/forwardCarriage" factory="TEXT" variation="original"/>
      <detector name="../../../../clas12/dc/dc"            factory="TEXT" variation="original"/>
      <detector name="../../../../clas12/ec/ec"            factory="TEXT" variation="original"/>
      <detector name="../../../../clas12/ctof/ctof"            factory="TEXT" variation="original"/>
      <detector name="../../../../clas12/ftof/ftof"            factory="TEXT" variation="original"/>
      <detector name="../../../../clas12/htcc/htcc"            factory="TEXT" variation="original"/>
      <detector name="../../../../clas12/pcal/pcal"            factory="TEXT" variation="javageom"/>
      <option name="SCALE_FIELD" value="clas12-torus-big, -1"/>
     <option name="OUTPUT" value="evio,eg12_nosol_1.ev"/>
     <option name="BEAM_P" value="e-, 6.0*GeV, 25.0*deg, 0*deg"/>
     <option name="SPREAD_P" value="4.0*GeV, 0*deg, 0*deg"/>
</gcard>
Here is the reconstruction command
~/src/CLAS/coatjava-1.0/bin/clas12-reconstruction -s FMT:DCHB:DCTB:FTOF:EC:EB -config DCTB::useRaster=true -config MAG::solenoid=0 -i eg12_nosol_1.ev -o eg12_nosol_1_rec.ev
Below is the command and the gcard used for when the solenoid was on
gemc -USE_GUI=0 -HALL_MATERIAL="Vacuum" , -N=100000 eg12_sol1.gcard
<gcard>
       <detector name="../../../../../clas12/fc/forwardCarriage" factory="TEXT" variation="original"/>
       <detector name="../../../../../clas12/dc/dc"            factory="TEXT" variation="original"/>
       <detector name="../../../../../clas12/ec/ec"            factory="TEXT" variation="original"/>
       <detector name="../../../../../clas12/ctof/ctof"            factory="TEXT" variation="original"/>
       <detector name="../../../../../clas12/ftof/ftof"            factory="TEXT" variation="original"/>
       <detector name="../../../../../clas12/htcc/htcc"            factory="TEXT" variation="original"/>
       <detector name="../../../../../clas12/pcal/pcal"            factory="TEXT" variation="javageom"/>
       <option name="SCALE_FIELD" value="clas12-torus-big, -1"/>
       <option name="HALL_FIELD"  value="clas12-solenoid"/>
       <option name="OUTPUT" value="evio,eg12_sol_1.ev"/>
       <option name="BEAM_P" value="e-, 6.0*GeV, 25.0*deg, 0*deg"/>
       <option name="SPREAD_P" value="4.0*GeV, 0*deg, 0*deg"/>
</gcard>
~/src/CLAS/coatjava-1.0/bin/clas12-reconstruction -s FMT:DCHB:DCTB:FTOF:EC:EB -config MAG::fields=nominal -config DATA::mc=true -i eg12_sol_1.ev -o eg12_sol_1_rec.evio
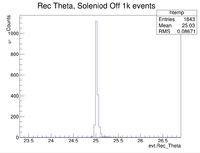
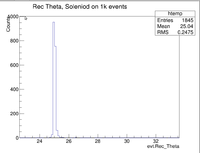
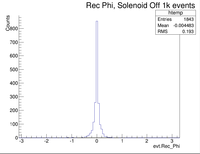
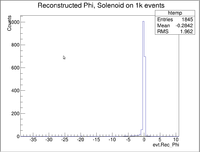
Below are the reconstructed events with the solenoid on and off for 1k events
Raster in Z
Since the LUND files are not currently operating correctly, I will use a different method to raster in Z. I will use the GEMC command line to reduce the radius of the target to 0 cm and randomly place vertex positions along Z (like a line target). The command line for GEMC is shown below along with the gcard when the solenoid is off:
~/src/CLAS/GEMC/source/gemc -USE_GUI=0 -SPREAD_V="(0.0, 3)cm" -N=100 eg12_nosol_noLUND.gcard
<gcard>
      <detector name="../../clas12/fc/forwardCarriage" factory="TEXT" variation="original"/>
      <detector name="../../clas12/dc/dc"            factory="TEXT" variation="ccdb"/>
      <detector name="../../clas12/ec/ec"            factory="TEXT" variation="original"/>
      <detector name="../../clas12/ctof/ctof"            factory="TEXT" variation="original"/>
      <detector name="../../clas12/ftof/ftof"            factory="TEXT" variation="java"/>
      <detector name="../../clas12/htcc/htcc"            factory="TEXT" variation="original"/>
      <detector name="../../clas12/pcal/pcal"            factory="TEXT" variation="javageom"/>
      <option name="SCALE_FIELD" value="clas12-torus-big, -1"/>
     <option name="OUTPUT" value="evio,eg12_nosol_75k_noLUND.ev"/>
     <option name="BEAM_P" value="e-, 6.0*GeV, 25.0*deg, 0*deg"/>
     <option name="SPREAD_P" value="4.0*GeV, 0*deg, 0*deg"/>
</gcard>
and here is the reconstruction command line ~/src/CLAS/coatjava-2.4/bin/clas12-reconstruction -i eg12_nosol_75k_noLUND.ev -config GEOM::new=true -config MAG::torus=-1.0 -config MAG::solenoid=0.0 -o eg12_nosol_75k_noLUND_rec.ev -s DCHB:DCTB:EC:FTOF:EB -config DATA::mc=true
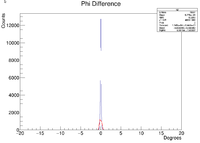
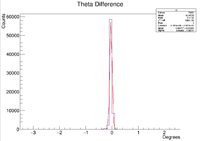
Below are the differences between the generated and reconstructed angles for 75k events:
Below are the command lines and gcard used for GEMC and the reconstruction software when the solenoid is on
~/src/CLAS/GEMC/source/gemc -USE_GUI=0 -SPREAD_V="(0.0, 3)cm" -N=75000 eg12_sol_noLUND.gcard
~/src/CLAS/coatjava-2.4/bin/clas12-reconstruction -i eg12_sol_75k_noLUND_3cm_Zraster.ev -config GEOM::new=true -config MAG::torus=-1.0 -config MAG::solenoid=1.0 -o eg12_sol_75k_noLUND_3cm_Zraster_rec.evio -s DCHB:DCTB:EC:FTOF:EB -config DATA::mc=true
<gcard>
      <detector name="../../../clas12/fc/forwardCarriage" factory="TEXT" variation="original"/>
      <detector name="../../../clas12/dc/dc"            factory="TEXT" variation="ccdb"/>
      <detector name="../../../clas12/ec/ec"            factory="TEXT" variation="original"/>
      <detector name="../../../clas12/ctof/ctof"            factory="TEXT" variation="original"/>
      <detector name="../../../clas12/ftof/ftof"            factory="TEXT" variation="java"/>
      <detector name="../../../clas12/htcc/htcc"            factory="TEXT" variation="original"/>
      <detector name="../../../clas12/pcal/pcal"            factory="TEXT" variation="javageom"/>
      <option name="SCALE_FIELD" value="clas12-torus-big, -1"/>
      <option name="HALL_FIELD"  value="clas12-solenoid"/>
      <option name="OUTPUT" value="evio,eg12_sol_75k_noLUND_3cm_Zraster.ev"/>
      <option name="BEAM_P" value="e-, 6.0*GeV, 25.0*deg, 0*deg"/>
      <option name="SPREAD_P" value="4.0*GeV, 0*deg, 0*deg"/>
</gcard>
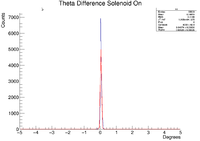
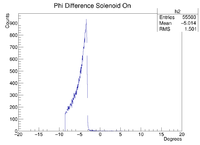
Below are the plots for the differences between the generated and the reconstructed values for theta and phi with the solenoid on for 75k events:
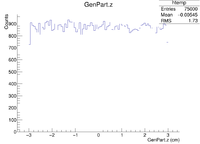
For the plots below I used a target with generated Z vertex positions ranging form -3cm to 3cm. The plot is shown below:
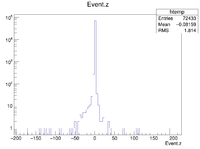
Below are the reconstructed Z vertex positions plotted on a log scale to show that some outliers exist
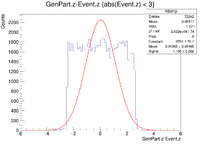
Finally the difference between the reconstructed and the generated Z vertex positions are plotted:
Raster in X
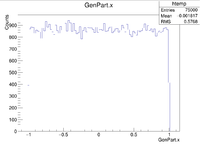
I simulated 75000 6GeV electron events fired at 25 degrees in theta and 0 degrees in phi with GEMC 2.4 and used an evio to root program to convert the reconstructed data to a root file. In the input LUND file for GEMC, I set the x vertex to raster by +/- 1cm. Vy and Vz were set to be generated at 0. Below is a plot of the generated x vertices in centimeters:
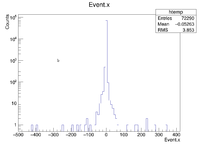
The reconstructed events were put on a log scale to show that there were some large outlying values, but those were removed when the difference was taken. The plot below also has its x reconstructed vertices in centimeters.
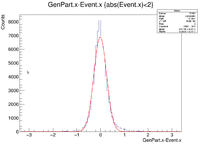
Finally the difference was take between these two values restricting that the reconstructed vertices are +/- 2cm.
The RMS, which gives the resolution can be seen to be 0.3427cm.
Raster in Y
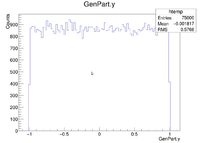
I simulated 75000 6GeV electron events fired at 25 degrees in theta and 0 degrees in phi with GEMC 2.4 and used an evio to root program to convert the reconstructed data to a root file. In the input LUND file for GEMC, I set the y vertex to raster by +/- 1cm. Vx and Vz were set to be generated at 0. Below is a plot of the generated y vertices in centimeters:
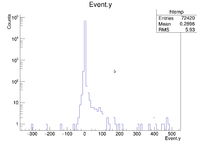
The reconstructed events were put on a log scale to show that there were some large outlying values, but those were removed when the difference was taken. The plot below also has its y reconstructed vertices in centimeters.
Finally the difference was take between these two values restricting that the reconstructed vertices are +/- 2cm.
It can be seen that the resolution is 0.3373cm
Raster in X & Y Zis zero
Below is the command line used for rastering in X and Y while leaving the z-component of the vertex at 0 with the solenoid off:
~/src/CLAS/GEMC/source/gemc -USE_GUI=0 -SPREAD_V="(0.5, 0)cm" -N=75000 eg12_nosol_noLUND.gcard
and here is the reconstruction command line
~/src/CLAS/coatjava-2.4/bin/clas12-reconstruction -i eg12_nosol_75k_noLUND_xyraster.ev -config GEOM::new=true -config MAG::torus=-1.0 -config MAG::solenoid=0.0 -o eg12_nosol_75k_noLUND_xyraster_rec.evio -s DCHB:DCTB:EC:FTOF:EB -config DATA::mc=true
Below are the differences between the reconstructed and the generated angles for rastering 1cm in XY:
Below are the command lines and the gcard used for when the solenoid was on:
~/src/CLAS/GEMC/source/gemc -USE_GUI=0 -SPREAD_V="(0.5, 0)cm" -N=75000 eg12_sol_noLUND.gcard
~/src/CLAS/coatjava-2.4/bin/clas12-reconstruction -i eg12_sol_75k_noLUND_1cm_XYraster.ev -config GEOM::new=true -config MAG::torus=-1.0 -config MAG::solenoid=1.0 -o eg12_sol_75k_noLUND_1cm_XYraster_rec.evio -s DCHB:DCTB:EC:FTOF:EB -config DATA::mc=true
<gcard>
      <detector name="../../../../clas12/fc/forwardCarriage" factory="TEXT" variation="original"/>
      <detector name="../../../../clas12/dc/dc"            factory="TEXT" variation="ccdb"/>
      <detector name="../../../../clas12/ec/ec"            factory="TEXT" variation="original"/>
      <detector name="../../../../clas12/ctof/ctof"            factory="TEXT" variation="original"/>
      <detector name="../../../../clas12/ftof/ftof"            factory="TEXT" variation="java"/>
      <detector name="../../../../clas12/htcc/htcc"            factory="TEXT" variation="original"/>
      <detector name="../../../../clas12/pcal/pcal"            factory="TEXT" variation="javageom"/>
      <option name="SCALE_FIELD" value="clas12-torus-big, -1"/>
      <option name="HALL_FIELD"  value="clas12-solenoid"/>
      <option name="OUTPUT" value="evio,eg12_sol_75k_noLUND_1cm_XYraster.ev"/>
      <option name="BEAM_P" value="e-, 6.0*GeV, 25.0*deg, 0*deg"/>
      <option name="SPREAD_P" value="4.0*GeV, 0*deg, 0*deg"/>
</gcard>
Here are the plots for the differences in the generated and reconstructed values for theta and phi with the solenoid on:
Raster in XYZ
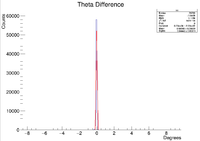
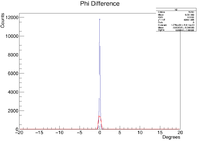
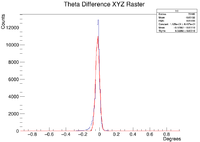
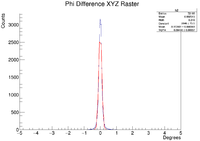
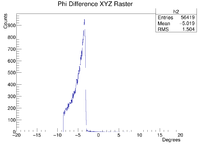
For this simulation I rastered the beam in the XY plane around 1cm, and z was rastered +/- 3cm. Below are the differences in the the generated and reconstructed angles for when the solenoid was off:
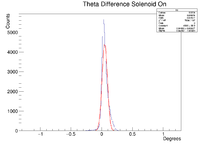
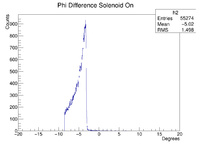
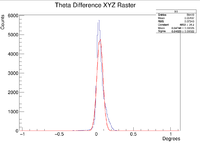
and here are the plots for when the solenoid was on:
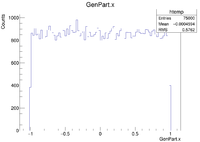
For the following plots I used a LUND file that generated a spread of X and Y vertices from -1cm to 1cm and Z vertices from -3cm to 3cm. Below are the plots for the generated X,Y, and Z vertices:
Electron Vertex reconstruction
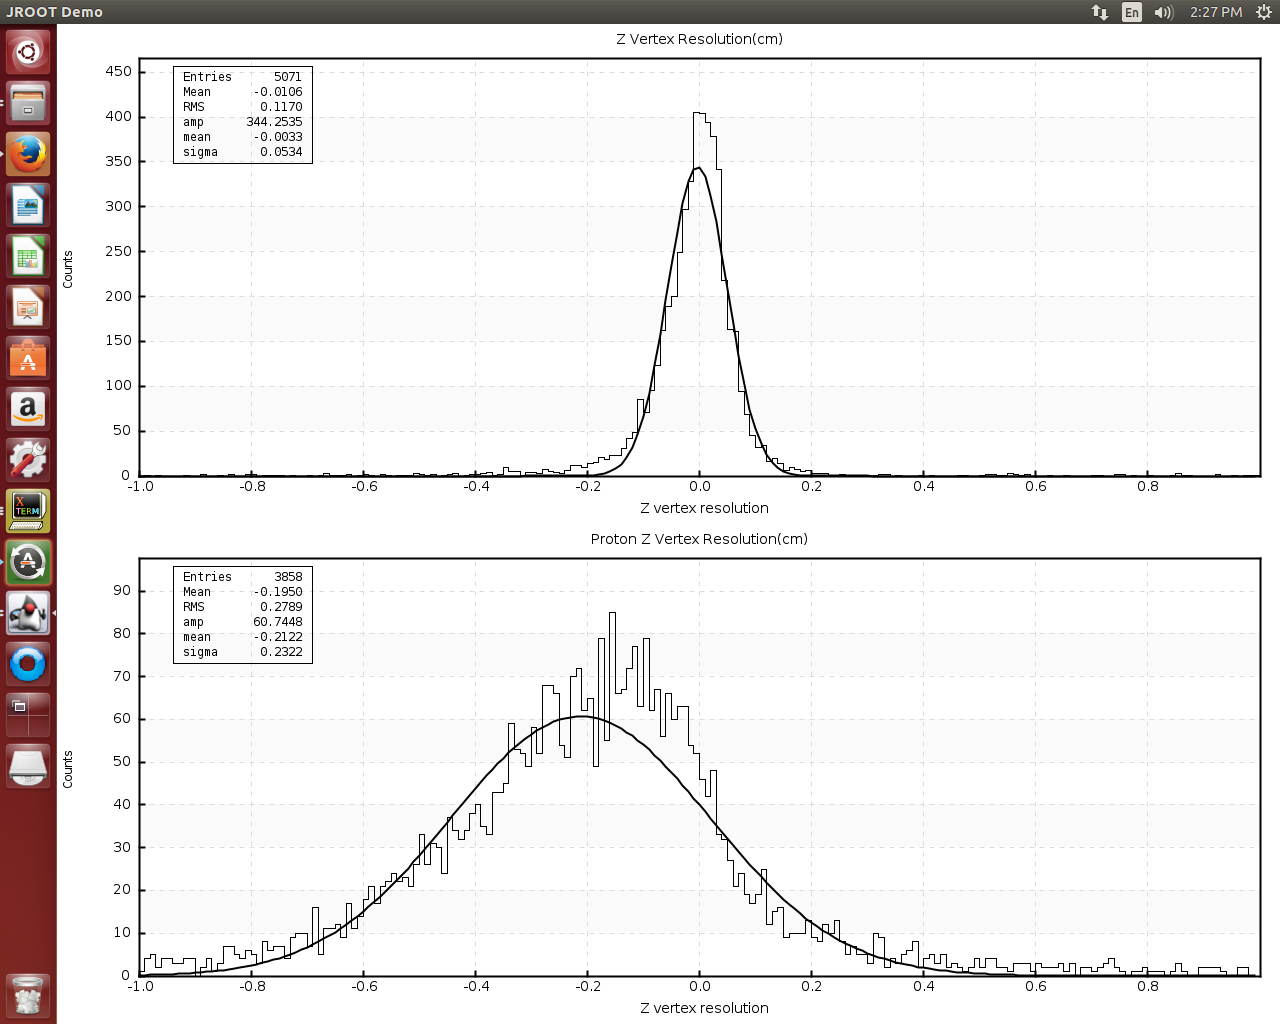
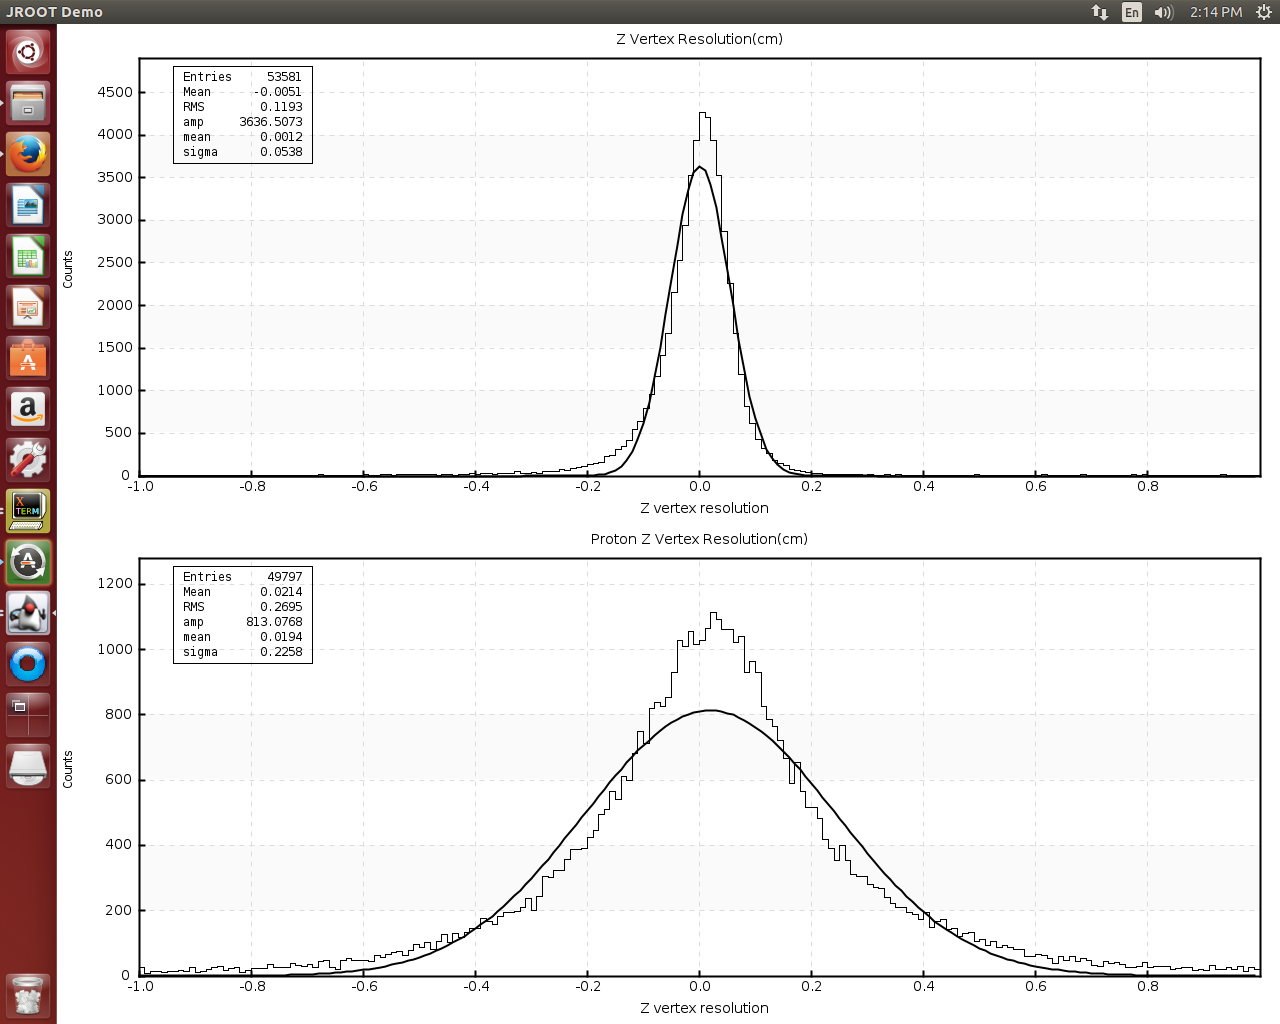
I have created histograms of the z-vertex resolutions for both the proton and the electron using elastic events from the origin. I used the gemc command line to output a file called eg12_lb_NoSol.ev
gemc -USE_GUI=0 -INPUT_GEN_FILE="LUND, ElasticEvents_FromOrigin.LUND" -N=75000 eg12.gcard
My gcard looks like this
      <detector name="../../../../clas12/fc/forwardCarriage" factory="TEXT" variation="original"/>
      <detector name="../../../../clas12/dc/dc"            factory="TEXT" variation="original"/>
      <detector name="../../../../clas12/ec/ec"            factory="TEXT" variation="original"/>
      <detector name="../../../../clas12/ctof/ctof"            factory="TEXT" variation="original"/>
      <detector name="../../../../clas12/ftof/ftof"            factory="TEXT" variation="original"/>
      <detector name="../../../../clas12/htcc/htcc"            factory="TEXT" variation="original"/>
       <detector name="../../../clas12/pcal/pcal"            factory="TEXT" variation="original"/>
      <option name="SCALE_FIELD" value="clas12-torus-big, -1"/>
     <option name="OUTPUT" value="evio,eg12_lb_NoSol.ev"/>
then I ran the reconstruction program using
~/src/CLAS/coatjava/bin/clas12-reconstruction -s FMT:DCHB:DCTB:FTOF:EC:EB -config DCTB::useRaster=true -config MAG::solenoid=0 -i eg12_lb_NoSol.ev -o eg12_lb_NoSol_rec.ev
After that I used the eg12_lb_NoSol_rec.ev to create the histograms
Here are the histograms when the solenoid is off
Then I ran the GEMC simulation with the solenoid on. My gcard was
<gcard>
      <detector name="../../clas12/fc/forwardCarriage" factory="TEXT" variation="original"/>
      <detector name="../../clas12/dc/dc"            factory="TEXT" variation="original"/>
      <detector name="../../clas12/ec/ec"            factory="TEXT" variation="original"/>
      <detector name="../../clas12/ctof/ctof"            factory="TEXT" variation="original"/>
      <detector name="../../clas12/ftof/ftof"            factory="TEXT" variation="original"/>
      <detector name="../../clas12/htcc/htcc"            factory="TEXT" variation="original"/>
      <detector name="../../clas12/pcal/pcal"            factory="TEXT" variation="original"/>
      <option name="SCALE_FIELD" value="clas12-torus-big, -1"/>
      <option name="HALL_FIELD"  value="clas12-solenoid"/>
     <option name="OUTPUT" value="evio, eg12_lb_Sol.ev"/>
</gcard>
Which gives the output file eg12_lb_Sol.ev. I used the GEMC command line
gemc -USE_GUI=0 -INPUT_GEN_FILE="LUND, ElasticEvents_FromOrigin.LUND" -N=75000 eg12_Sol.gcard
Then I made the reconstructed file, eg12_lb_Sol_rec.ev using the command line
~/src/CLAS/coatjava//bin/clas12-reconstruction -s FMT:DCHB:DCTB:FTOF:EC:EB -config MAG::fields=nominal -i eg12_Sol.ev -o eg12_lb_Sol_rec.ev
The histogram is below
Now I will get more simulated events and use the java geometry for the pcal and the LUND file Vertex0.075k_10-40.dat and investigate the Z vertex resolution using different radius cuts.
