Difference between revisions of "TF IsotopeTracers4Cracks"
| (43 intermediate revisions by the same user not shown) | |||
| Line 83: | Line 83: | ||
==Rates== | ==Rates== | ||
| + | |||
| + | A uniform point source sent 10^7 photons of a specific energy in all directions. | ||
| + | |||
| + | 1 Curie = <math>3.7 \times 10^{10}</math> decays/sec | ||
===Surface rates -vs- Crack size=== | ===Surface rates -vs- Crack size=== | ||
| Line 88: | Line 92: | ||
The crack size decreases as you move from left to right in the table. | The crack size decreases as you move from left to right in the table. | ||
| − | The result below is from a 1800 keV uniform point source and a 10 cm thick shale wall with a cylindrical hole through the center (X=0:Y=0) | + | |
| + | A projection is made along the X-axis with the cuts | ||
| + | |||
| + | #radius < 100 cm | ||
| + | #Energy > Source energy (0.7 or 1.7 MeV) | ||
| + | |||
| + | |||
| + | The result below is from a '''1800 keV''' uniform point source and a 10 cm thick shale wall with a cylindrical hole through the center (X=0:Y=0) | ||
| + | |||
| + | {| border="1" |cellpadding="20" cellspacing="0 | ||
| + | |- | ||
| + | |[[File:TF_100mmCrack_XvsY.png| 200 px]] || [[File:TF_25mmCrack_XvsY.png| 200 px]]|| [[File:TF_10mmCrack_XvsY.png| 200 px]]|| [[File:TF_5mmCrack_XvsY.png| 200 px]]|| [[File:TF_1mmCrack_XvsY.png| 200 px]] | ||
| + | |- | ||
| + | |100 mm hole|| 25 mm hole||10 mm ||5 mm|| 1 mm | ||
| + | |- | ||
| + | |} | ||
| + | |||
| + | |||
| + | The result below is from a '''895 keV''' uniform point source and a 10 cm thick shale wall with a cylindrical hole through the center (X=0:Y=0) | ||
| + | |||
| + | {| border="1" |cellpadding="20" cellspacing="0 | ||
| + | |- | ||
| + | |[[File:TF895_100mmCrack_XvsY.png| 200 px]] || [[File:TF895_25mmCrack_XvsY.png| 200 px]]|| [[File:TF895_10mmCrack_XvsY.png| 200 px]]|| [[File:TF895_5mmCrack_XvsY.png| 200 px]]|| [[File:TF895_1mmCrack_XvsY.png| 200 px]] | ||
| + | |- | ||
| + | |100 mm hole|| 25 mm hole||10 mm ||5 mm|| 1 mm | ||
| + | |- | ||
| + | |} | ||
| + | |||
| + | '''Now change the detector size from a 5 x 5 cm area to a 0.5 x 0.5 cm area.''' | ||
{| border="1" |cellpadding="20" cellspacing="0 | {| border="1" |cellpadding="20" cellspacing="0 | ||
|- | |- | ||
| − | |[[File: | + | |[[File:TF_100mmCrack_XvsY5x5.png| 200 px]] || [[File:TF_25mmCrack_XvsY5x5.png| 200 px]]|| [[File:TF_10mmCrack_XvsY5x5.png| 200 px]]|| [[File:TF_5mmCrack_XvsY5x5.png| 200 px]]|| [[File:TF_1mmCrack_XvsY5x5.png| 200 px]] |
|- | |- | ||
| − | |100 mm hole|| | + | |100 mm hole|| 25 mm hole||10 mm ||5 mm|| 1 mm |
|- | |- | ||
|} | |} | ||
| − | == | + | The result below is from a '''895 keV''' uniform point source and a 10 cm thick shale wall with a cylindrical hole through the center (X=0:Y=0) |
| − | A | + | {| border="1" |cellpadding="20" cellspacing="0 |
| + | |- | ||
| + | |[[File:TF895_100mmCrack_XvsY5x5.png| 200 px]] || [[File:TF895_25mmCrack_XvsY5x5.png| 200 px]]|| [[File:TF895_10mmCrack_XvsY5x5.png| 200 px]]|| [[File:TF895_5mmCrack_XvsY5x5.png| 200 px]]|| [[File:TF895_1mmCrack_XvsY5x5.png| 200 px]] | ||
| + | |- | ||
| + | |100 mm hole|| 25 mm hole||10 mm ||5 mm|| 1 mm | ||
| + | |- | ||
| + | |} | ||
| + | |||
| + | ==== Projections==== | ||
| + | |||
| + | As observed above, the 1 mm radius hole may be observed if you use a detector that is 5 x 5 mm. | ||
| + | |||
| + | |||
| + | |||
| + | Notice that the 895 keV photons show a more distinct peak for the 1 mm radius holes than the 1800 keV photons. The bins are 2cm in size to represent a 2 cm x 2cm area detector. A cut was made restricting the Y-position to +/- 1 cm. | ||
| + | |||
| + | |||
| + | |||
| + | |||
| + | {| border="1" |cellpadding="20" cellspacing="0 | ||
| + | |- | ||
| + | |[[File:41113EnergyDep_100mmHole_2x2cmdetectr.png| 200 px]] || [[File:41113EnergyDep_25mmHole_2x2cmdetectr.png| 200 px]]|| [[File:41113EnergyDep_10mmHole_2x2cmdetectr.png| 200 px]]|| [[File:41113EnergyDep_5mmHole_2x2cmdetectr.png| 200 px]]|| [[File:41113EnergyDep_1mmHole_2x2cmdetectr.png| 200 px]] | ||
| + | |- | ||
| + | |100 mm hole|| 25 mm hole||10 mm ||5 mm|| 1 mm | ||
| + | |- | ||
| + | |} | ||
| + | |||
| + | ===Peak ratio -vs- distance from center=== | ||
| + | |||
| + | The analysis below compares the number of photons at two energies of 0.895 and 1.8 MeV that penetrating the shale as a function of the distance from the radial center. A 2 x 2 cm detector is used. | ||
| + | |||
| + | |||
| + | sample root command | ||
| + | PhotonTrack->Draw("evt.Energy","sqrt(evt.PosX*evt.PosX+evt.PosY*evt.Poroot [27] abs(evt.PosY)<1 &&evt.PosX>0 && evt.PosX< 4 && evt.Energy>1.7"); | ||
| + | |||
| + | |||
| + | {| border="1" |cellpadding="20" cellspacing="0 | ||
| + | |- | ||
| + | | rowspan="3" | Distance (cm) ||colspan="16" style="text-align: center;" | Energy | ||
| + | |- | ||
| + | | colspan="3" style="text-align: center;" | 100 mm hole|| colspan="3" style="text-align: center;" | 25 mm hole||colspan="3" style="text-align: center;" | 10 mm ||colspan="3" style="text-align: center;" | 5 mm|| colspan="3" style="text-align: center;" | 1 mm | ||
| + | |- | ||
| + | | 0.895 MeV ||1.8 || Ratio||0.895 || 1.8 ||Ratio||0.895 ||1.8 ||Ratio||0.895 ||1.8 ||Ratio||0.895 ||1.8 ||Ratio | ||
| + | |- | ||
| + | |2 ||144 ||285 || 0.51 || | ||
| + | |} | ||
| − | |||
| − | |||
| − | |||
[[TF_IsotopeTracers#Tracers_for_Cracks]] | [[TF_IsotopeTracers#Tracers_for_Cracks]] | ||
Latest revision as of 18:37, 17 April 2013
Definition of Shale
Shale was assumed to have the chemical composition of
and a density of 2.6 g/
G4Element* O = new G4Element("Oxygen"  , "O", z=8., a= 16.00*g/mole);
G4Element* Al = new G4Element("Aluminum"  , "Al", z=13., a= 26.98*g/mole);
G4Element* Si = new G4Element("Silicon"  , "Si", z=14., a= 28.085*g/mole);
G4Element* H = new G4Element("Hydrogen"  , "H", z=1., a= 1.008*g/mole);

G4Material* Shale = new G4Material("Shale", density= 2.6*g/cm3, nel=4);
Shale->AddElement(Al, 15*perCent);
Shale->AddElement(Si, 15*perCent);
Shale->AddElement(O, 38*perCent);
Shale->AddElement(H, 32*perCent);
Photon Attenuation in Shale
According to the XCOM database, the attenuation length for a 1.8 MeV photon is 0.16 /cm and 0.895 is 0.22/cm through shale.
File:XCOM attenuation4Shale.pdf
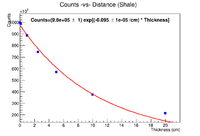
Directing a 1.8 MeV beam of photons in GEANT4 towards various thicknesses of shale produced the graph below.
XCOM predicts an attenuation coefficient of 0.0441 cm^2/g which becomes 0.12/cm when you multiply by the shale density of 2.6 g/cm^3. The fit to GEANT4's predictions above produces a value of 0.1/cm when you plot the number of photons that pass through the shale and still have an energy of 1.8 MeV.
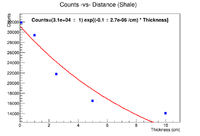
If I use a point source isotropically emitting 1800 keV photons I observe
which gives a the value of 0.1/cm as well.
Yittrium in Shale
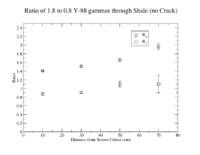
A simulation of the penetration of the 0.895 and 1.8 MeV photons from Yittrium through shale.
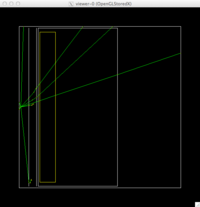
GEANT4 create a point source or 895 keV photon and another with 1800 keV photons iostropically distributed.
A 4" thick piece of shale was placed between the source and the detector.
Two ratios were constructed.
Insert a single crack
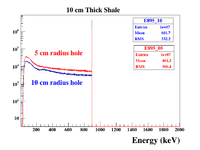
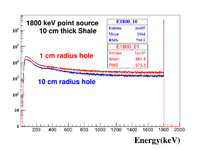
A simulation was performed that predicted the transmission of photons through 10 centimeters of shale. The shale is in the form of a cylinder with a hole through the central axis.
The source was a uniform points source. One set of simulations used a 1.8 MeV photon and another used a 0.895 photon.
Energy distribution
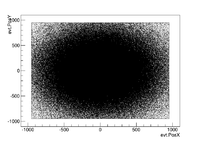
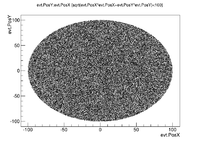
Position Distribution
The Shale is a cylinder and the detector is a rectangle. A cut is used to look only at photons within the cylinder.
Units are Centimeters.
Rates
A uniform point source sent 10^7 photons of a specific energy in all directions.
1 Curie = decays/sec
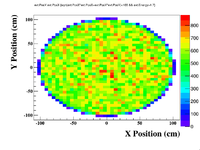
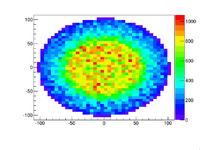
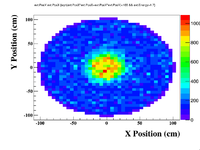
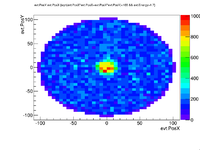
Surface rates -vs- Crack size
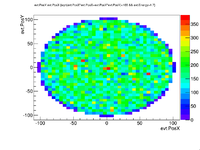
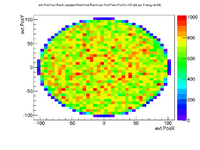
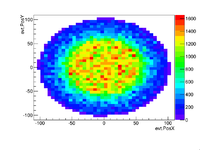
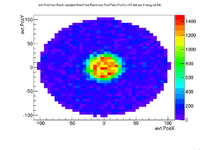
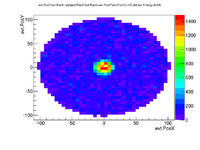
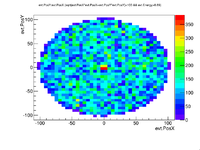
The crack size decreases as you move from left to right in the table.
A projection is made along the X-axis with the cuts
- radius < 100 cm
- Energy > Source energy (0.7 or 1.7 MeV)
The result below is from a 1800 keV uniform point source and a 10 cm thick shale wall with a cylindrical hole through the center (X=0:Y=0)
 |
 |
 |
 |
|
| 100 mm hole | 25 mm hole | 10 mm | 5 mm | 1 mm |
The result below is from a 895 keV uniform point source and a 10 cm thick shale wall with a cylindrical hole through the center (X=0:Y=0)
 |
 |
 |
 |
|
| 100 mm hole | 25 mm hole | 10 mm | 5 mm | 1 mm |
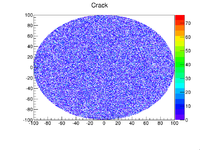
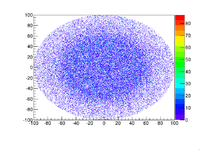
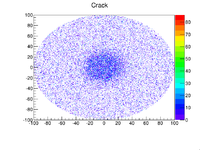
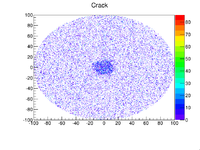
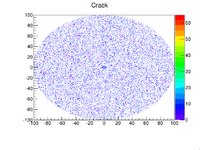
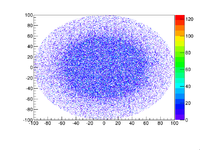
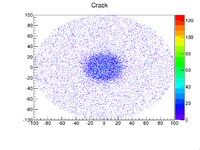
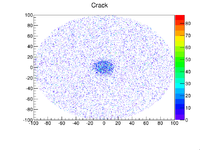
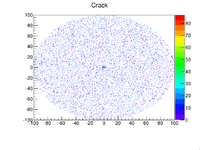
Now change the detector size from a 5 x 5 cm area to a 0.5 x 0.5 cm area.
 |
 |
 |
 |
|
| 100 mm hole | 25 mm hole | 10 mm | 5 mm | 1 mm |
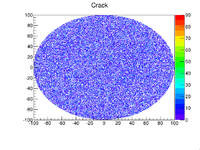
The result below is from a 895 keV uniform point source and a 10 cm thick shale wall with a cylindrical hole through the center (X=0:Y=0)
 |
 |
 |
 |
|
| 100 mm hole | 25 mm hole | 10 mm | 5 mm | 1 mm |
Projections
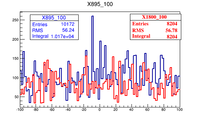
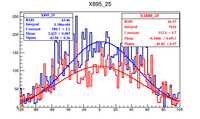
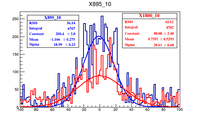
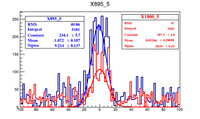
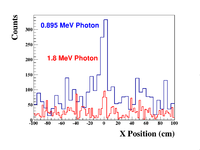
As observed above, the 1 mm radius hole may be observed if you use a detector that is 5 x 5 mm.
Notice that the 895 keV photons show a more distinct peak for the 1 mm radius holes than the 1800 keV photons. The bins are 2cm in size to represent a 2 cm x 2cm area detector. A cut was made restricting the Y-position to +/- 1 cm.
 |
 |
 |
 |
|
| 100 mm hole | 25 mm hole | 10 mm | 5 mm | 1 mm |
Peak ratio -vs- distance from center
The analysis below compares the number of photons at two energies of 0.895 and 1.8 MeV that penetrating the shale as a function of the distance from the radial center. A 2 x 2 cm detector is used.
sample root command
PhotonTrack->Draw("evt.Energy","sqrt(evt.PosX*evt.PosX+evt.PosY*evt.Poroot [27] abs(evt.PosY)<1 &&evt.PosX>0 && evt.PosX< 4 && evt.Energy>1.7");
| Distance (cm) | Energy | |||||||||||||||
| 100 mm hole | 25 mm hole | 10 mm | 5 mm | 1 mm | ||||||||||||
| 0.895 MeV | 1.8 | Ratio | 0.895 | 1.8 | Ratio | 0.895 | 1.8 | Ratio | 0.895 | 1.8 | Ratio | 0.895 | 1.8 | Ratio | ||
| 2 | 144 | 285 | 0.51 | |||||||||||||
