Single thorium target
The simulation
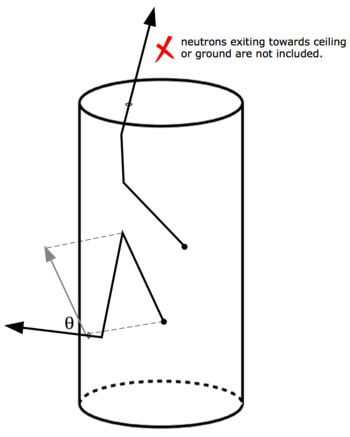
Neutrons are generated uniformly within a cylindrical target with an energy sampled from a Watt fission spectrum. The angle between the direction that the neutron is traveling at birth and upon exiting the target volume is calculated. The picture below illustrates this angle. The arrows are neutron trajectories, and the dots at the beginning of the trajectories represent the location where the neutron was generated. Neutrons that exit the target on a trajectory which will not intersect with a detector are not counted, e.g. neutrons going towards the ceiling or the ground.
Thorium-232
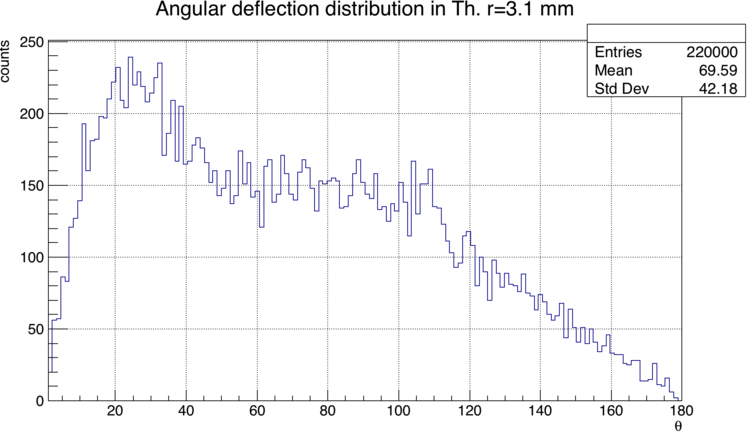
With a target radius of 3.1 mm, 8.2% of total simulated neutrons did scatter in the target (at least once), while the remaining 91.8% passed through freely. Out of all the neutrons that did scatter, 96% did so at an angle greater than 10 degrees. Because of the high tendency of neutrons to scatter at sharp angles, this analysis considers all neutrons that scatter as contaminated data. Below is the distribution of the angle of deflection for all the neutrons that did scatter for a target radius of 3.1 mm.
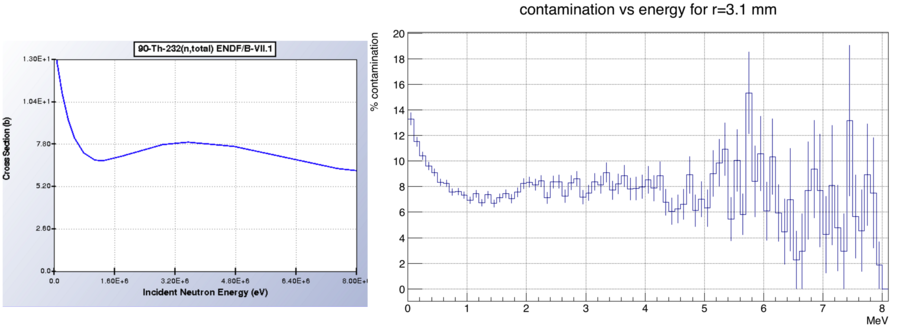
Below and left is a plot of the total cross section of Th-232. To the right is the simulated percent contamination for a target radius of 3.1 mm. At this radius, an MCNP F4 tally gave an average neutron track length (within the target) of 3.7 mm. The simulated percent contamination matches very closely with the probability of interaction calculated from the total cross section and average track length. All simulated neutrons are included in this plot, i.e. neutrons are not thrown away if they are traveling towards the ground or ceiling.
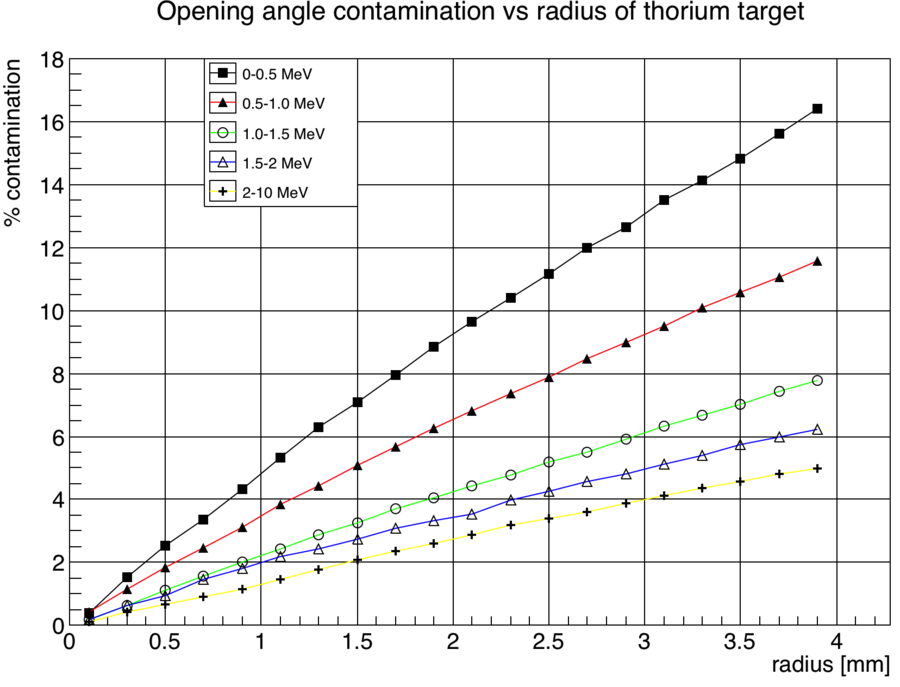
Below shows the percent contamination vs target radius for various different energy intervals. The energy of the neutron after it exits the target is the energy used for this data.
Go back JB Analysis


