Difference between revisions of "Sadiq Thesis"
| Line 240: | Line 240: | ||
| − | <math>\Delta R = \sqrt{\frac { \Delta N_{e^+}^2 }{ N_{e^-}^{2} } + (- \frac{ N_{e^+} }{ N_{e^-}^{2} })^2 \Delta N_{e^-}^{2} } = \frac{\sqrt{ \Delta N_{e^+}^{2} + \frac{ N_{e^+}^{2} }{ N_{e^-}^{2} } \Delta N_{e^-}^{2} }}{ N_{e^-}}</math> | + | <math>\Delta R = \sqrt{\frac { \Delta N_{e^+}^2 }{ N_{e^-}^{2} } + (- \frac{ N_{e^+} }{ N_{e^-}^{2} })^2 \Delta N_{e^-}^{2} } = \frac{\sqrt{ \Delta N_{e^+}^{2} + \frac{ N_{e^+}^{2} }{ N_{e^-}^{2} } \Delta N_{e^-}^{2} }}{ N_{e^-}}</math> = \frac{\sqrt{ \Delta N_{e^+}^{2} + \frac{ N_{e^+}^{2} }{ N_{e^-}^{2} } \Delta N_{e^-}^{2} }}{ N_{e^-}}</math> |
Revision as of 22:08, 5 October 2012
Introduction
Positron
Positron is the antimatter of electron. Positrons have same mass as electron ( ), carries positive charge, and it is noted as "".
Positrons predicted by Paul Dirac in 1928, <ref name="Dirac1928"> The Quantum Theory of the Electron, P. A. M. Dirac, Proc. R. Soc. Lond. A February 1, 1928 117 778 610-624;</ref>, and experimentally observed by Dmitri Skobeltsyn in 1929 and by Carl D. Anderson in 1932 <ref name="e+_discover"> General Chemistry, Taylor and Francis. p. 660. </ref>. Anderson also coined the term positron and he won the Nobel Prize for Physics in 1936.
<ref name="name"> BOOK_Gernal, Auther, Month_Year,issue,page </ref>
Positron Beamline History
Theory
positron creation from Bremsstrahlung
Positron rate prediction
Apparatus
HRRL Positron Beamline
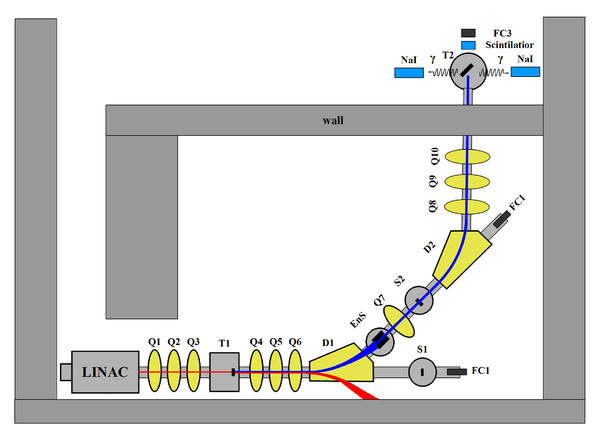
HRRL beamline layout is given in the figure below, and the item descriptions are given in the table below.
| Item | Description |
| T1 | Positron target |
| T2 | Annihilation target |
| EnS | Energy Slit |
| FC1, FC2 | Faraday Cups |
| Q1,...Q10 | Quadrupoles |
| D1, D2 | Dipoles |
| NaI | NaI Detecotrs |
| OTR | Optical Transition Radiaiton screen |
| YAG | Yttrium Aluminium Garnet screen |
Som parameters of HRRL is given by:
| Parameter | Unit | Value |
| maximum energy | MeV | 16 |
| peak current | mA | 100 |
| repetition rate | Hz | 300 |
| absolute energy spread | MeV | 2-4 |
| macro pulse length | ns | >50
|
Beam properties
Emittance Measurement
Emittance is an important parameter in accelerator physics. If emittance with twiss parameters are given at the exit of the gun, we will be able to calculate beam size and divergence any point after the exit of the gun. Knowing the beam size and beam divergence on the positron target will greatly help us study the process of creating positron. Emittance with twiss parameters are also key parameters for any accelerator simulations. Also, energy and energy spread of the beam will be measured in the emittance measurement.
What is Emittance
In accelerator physics, Cartesian coordinate system was used to describe motion of the accelerated particles. Usually the z-axis of Cartesian coordinate system is set to be along the electron beam line as longitudinal beam direction. X-axis is set to be horizontal and perpendicular to the longitudinal direction, as one of the transverse beam direction. Y-axis is set to be vertical and perpendicular to the longitudinal direction, as another transverse beam direction.
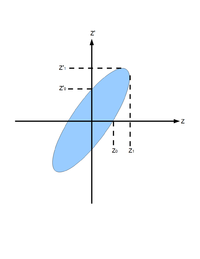
For the convenience of representation, we use to represent our transverse coordinates, while discussing emittance. And we would like to express longitudinal beam direction with . Our transverse beam profile changes along the beam line, it makes is function of , . The angle of a accelerated charge regarding the designed orbit can be defined as:
If we plot vs. , we will get an ellipse. The area of the ellipse is an invariant, which is called Courant-Snyder invariant. The transverse emittance of the beam is defined to be the area of the ellipse, which contains 90% of the particles <ref name="MConte08"> M. Conte and W. W. MacKay, “An Introduction To The Physics Of Particle Accelera tors”, World Scientifc, Singapore, 2008, 2nd Edition, pp. 257-330. </ref>.
By changing quadrupole magnetic field strength , we can change beam sizes on the screen. We make projection to the x, y axes, then fit them with Gaussian fittings to extract rms beam sizes, then plot vs vs . By Fitting a parabola we can find constants ,, and , and get emittances.
Emittance Measurements with an OTR
A beam emittance measurement of the HRRL was performed at Idaho State University's IAC with YAG (Yttrium Aluminium Garnet) was performed. Due to the high sensitivity of YAG, the beam image was saturated and beam spot pears rather big. Comparison study shows that for same beam YAG screen shows bigger beam size than Optical Transition Radiation (OTR) screen. An OTR based viewer was installed to allow measurements at the high electron currents available using the HRRL.
The OTR screen is 10 thick aluminium. Beam images were taken with digital CCD camera, a MATLAB tool were used to extract beamsize and emittance.
The visible light from the OTR based viewer is produced when a relativistic electron beam crosses the boundary of two mediums with different dielectric constants. Visible radiation is emitted at an angle of 90 degree with respect to the incident beam direction<ref name="OTR"> Tech. Rep., B. Gitter, Los Angeles, USA (1992). </ref> when the electron beam intersects the OTR target at a 45 degree angle. These backward-emitted photons are observed using a digital camera and can be used to measure the shape and intensity of the electron beam based on the OTR distribution.
Quadrupole Scanning Method
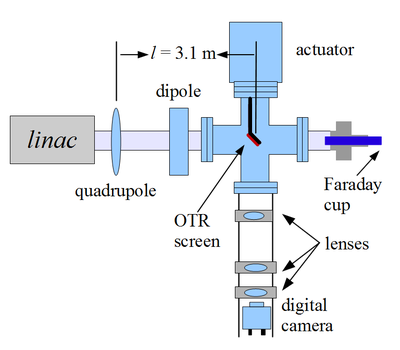
Figure on the right illustrates the apparatus used to measure the emittance using the quadrupole scanning method. A quadrupole is positioned at the exit of the linac to focus/de-focus the beam as observed on a downstream view screen. The 3.1~m distance between the quadrupole and the screen was chosen in order to minimize chromatic effects and to satisfy the thin lens approximation.
Experimental setup is shown in the following figure
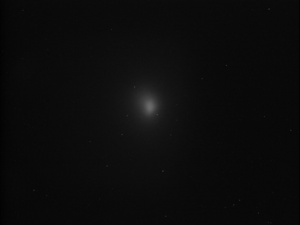
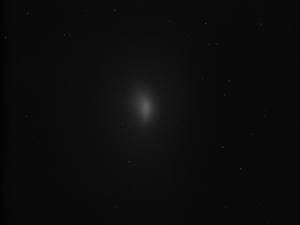
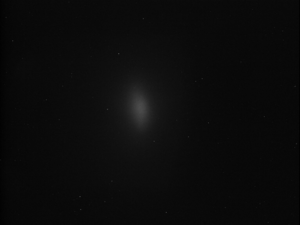
I chose one of the quad at a time to do the scan and turned off all the other quads. Optical transition radiation was observed at OTR target. At the end of 0 degree beamline I had a Faraday cup to measure the charge of the beam. Camera cage system was located below the OTR target. There are 3 lenses used to focus lights from target to the CCD camera. Target can be pushed into or taken out of the beamline by the actuator at the top.
OTR Target can be pushed into or taken out of the beamline vertically by the actuator at the top, which is attached to the 6-way cross. This actuator controlled remotely at the control desk.
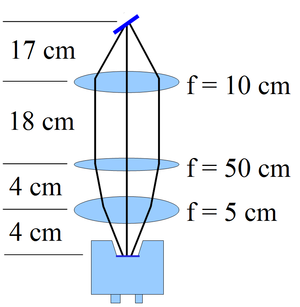
Camera cage system was located below the OTR target. Cage system attached to the bottom of the 6-way cross. Lower end of cross is a transparent window. There are 3 lenses used to focus lights from target to the CCD camera. They have focal length of 100 mm, 500 mm, and 50 mm.
The lens closest to the OTR target is 10 cm away from the target, an it has 100 mm focal length. This lens was located as close to the target as possible, so that we might collect as much OTR light as possible, and it was thus called collector lens. The lens in the middle has focal length of 500 mm. Moving this lens will change total focal length in a small amount, and this allow us to do fine tuning. Thus, we called this lens fine tuning lens. The last lens, which is furthest from target, and closed to the CCD camera has the shortest focal length of 5o mm. Its short focal length allow us to focus the light on the very small sensing area of the CCD camera.
Experiment with OTR
Optical Transition Radiation (OTR): Transition radiation is emitted when a charge moving at a constant velocity cross a boundary between two materials with different dielectric constant.
When relativistic electron beam pass through Aluminum target OTR is produced. OTR are taken for different quadrupole coil currents.
Data Analysis and Results
The projection of the beam is not Gaussian distribution. So, I fit Super Gaussian fitting <ref name="BeamDisBeyondRMS"> F.-J Decker, “Beam Distributions Beyond RMS”, BIW94, Vancouver,CA,Sep 1994, . </ref>.
I used the MATLAB to analyze the data. The results shows that:
Energy Spread Measurement
Current, rep-rate
Radiation Footprint
Positron detection
DAQ setup
Data Analysis
Signal extraction
For 3 MeV and on detector show all the steps
- Raw counts target in and out (calibrated energy)
- Normalized counts
- background subtracted
- Integral (zoomed in and with error)
Example of error propagation for the above
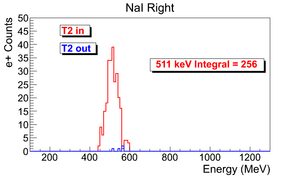
Raw counts target in and out
The ingeral shown in read is from the background is subtracted spectrum.
| run in | run out | NaI Left: image with cut | NaI Right: image with cut | 3735 | 3736 | 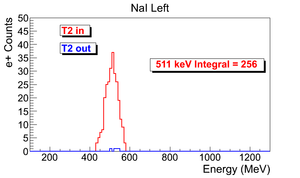
|
|
Reprate = 300 Hz
Run time = 1002 s
Pulses = 301462
Events = 9045 (Hz)
e+ rate NaI Left = 256 +- 16 (Hz).
Normalized counts
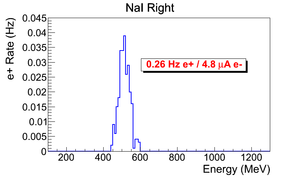
This a normalized spectrum (no background subtraction).
| run in | run out | NaI Left: image with cut | NaI Right: image with cut | 3735 | 3736 | 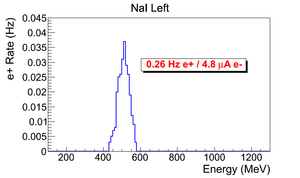
|
|
3735 and 3736
Reprate = 300 Hz
Run time = 1002 s
Pulses = 301462
Events = 9045
Total number of electrons in this run = 2.98568e+016 +- 4.49846e+015
Total charge of electrons in this run = 0.00478358 +- 0.000720733 C
e- rate = 2.97972e+013 +- 4.48948e+012 (Hz)
e- current:I_e- =4.77403e-006+-7.19295e-007 (A).
e+ rate = 0.259481 +- 0.0160923 (Hz).
Ne+/Ne-=8.70825e-015+-1.41886e-015.
Ne+/I_e-=0.25948 Hz e+ / 4.774 A e-
hand calculation of error
= \frac{\sqrt{ \Delta N_{e^+}^{2} + \frac{ N_{e^+}^{2} }{ N_{e^-}^{2} } \Delta N_{e^-}^{2} }}{ N_{e^-}}</math>
Background subraction
Sources of Systematic Errors
Efficiency measurement
acceptance, quad collection efficiency,
Conclusion
References
<references/>
