Difference between revisions of "Runs 4111(D2O)/4112(H2O)"
Jump to navigation
Jump to search
| Line 23: | Line 23: | ||
Errors on the neutron energy for the case of Det M: | Errors on the neutron energy for the case of Det M: | ||
| − | <math>E_n \pm U(E_n)= | + | <math>E_n \pm U(E_n)=m_nc^2/2 \cdot 1/c^2 \cdot (l_n/t_n)^2 \cdot [1 \pm 2 \sqrt{U^2(l_n)/l^2_n + U^2(t_n)/t^2_n}]</math> |
Where uncertainty in the neutron flight pass due to the finite width of the detector (14.8 cm) <math>U(l_n) = 14.8cm/2 \cdot cos(\theta)</math> and uncertainty in zero time definition in neutron TOF spectrum <math>U(t_n)=10 ns</math> | Where uncertainty in the neutron flight pass due to the finite width of the detector (14.8 cm) <math>U(l_n) = 14.8cm/2 \cdot cos(\theta)</math> and uncertainty in zero time definition in neutron TOF spectrum <math>U(t_n)=10 ns</math> | ||
Revision as of 22:58, 3 September 2012
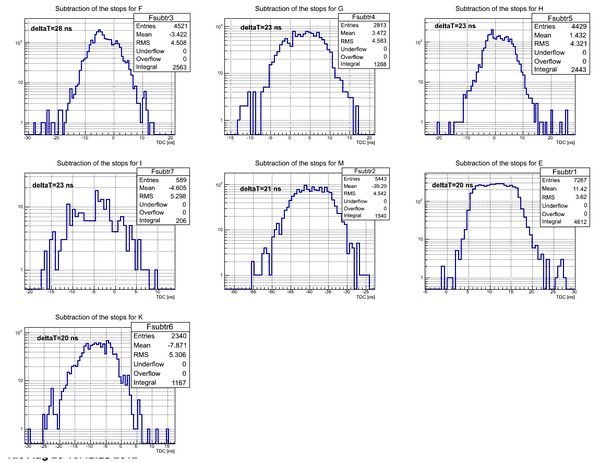
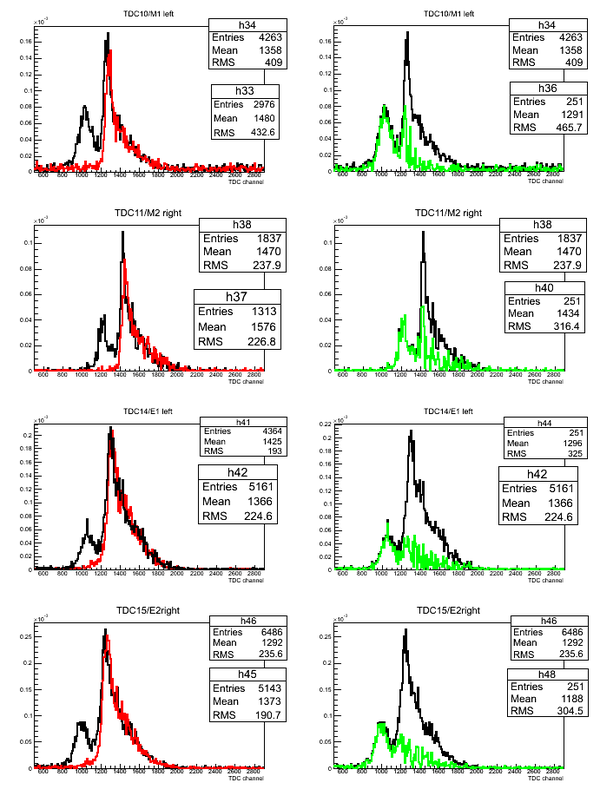
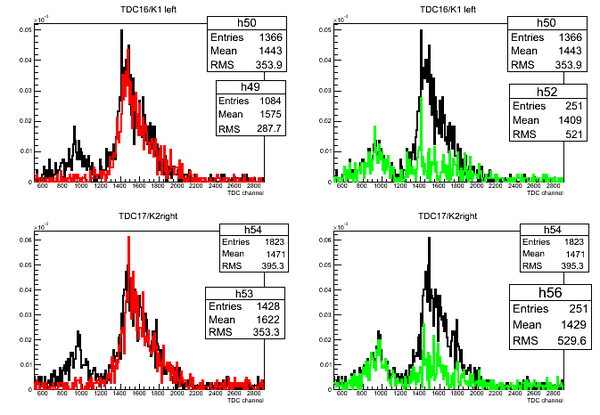
Subtraction of the stops for each detector in the case of D2O target. The length of the active area (scintillator) of the detector is 75.3 cm.
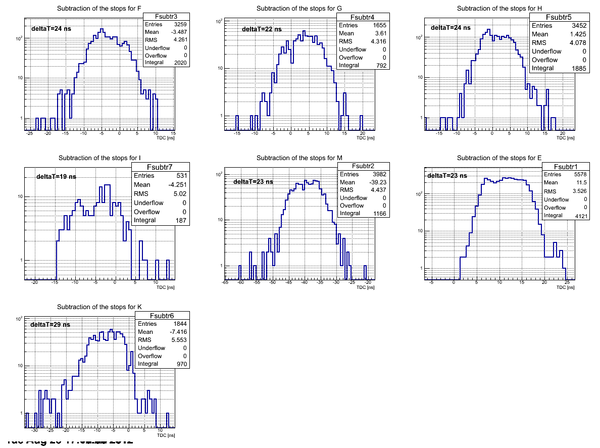
Subtraction of the stops for each detector in the case of H2O target:
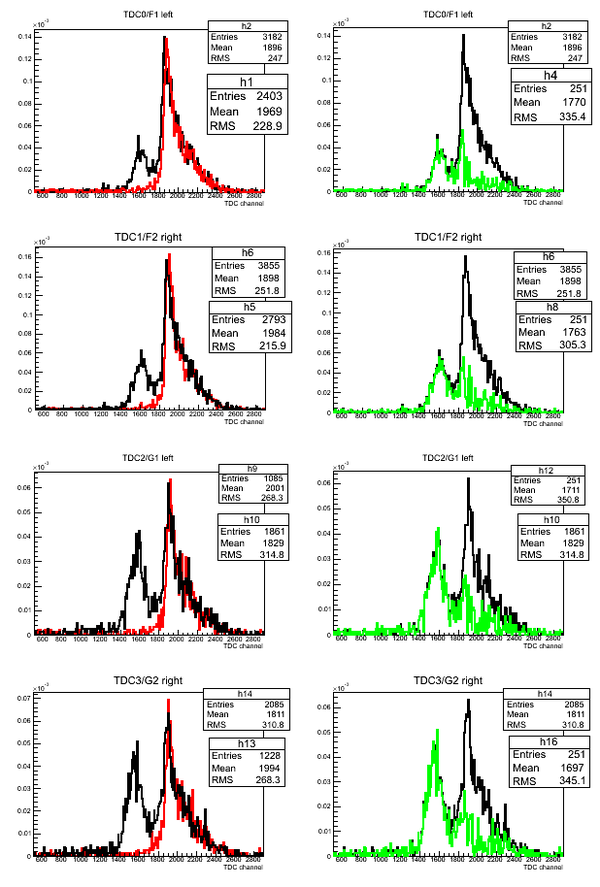
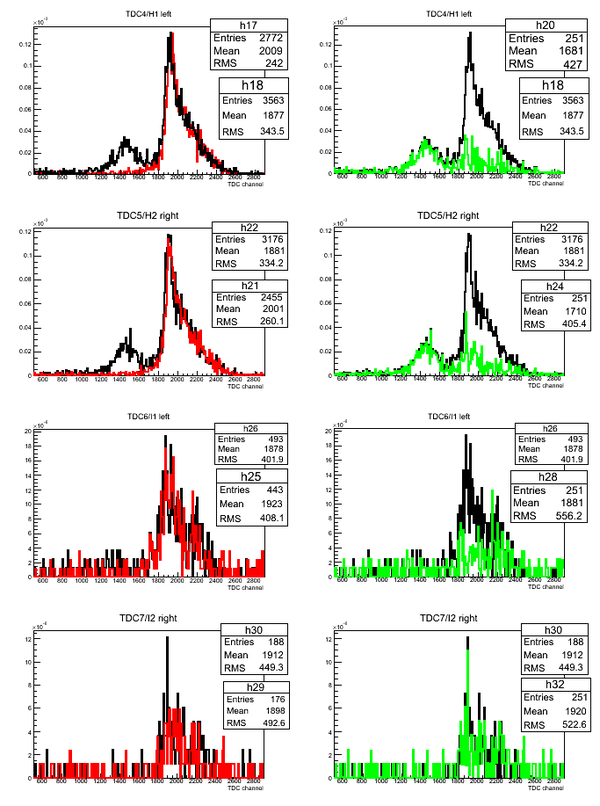
Normalized superimposed timing spectra from D2O(black line)/H2O(red line) targets and bin-by-bin subtraction (green line) of D2O-H2O data:
Neutron energy distribution data analysis for run 4111:
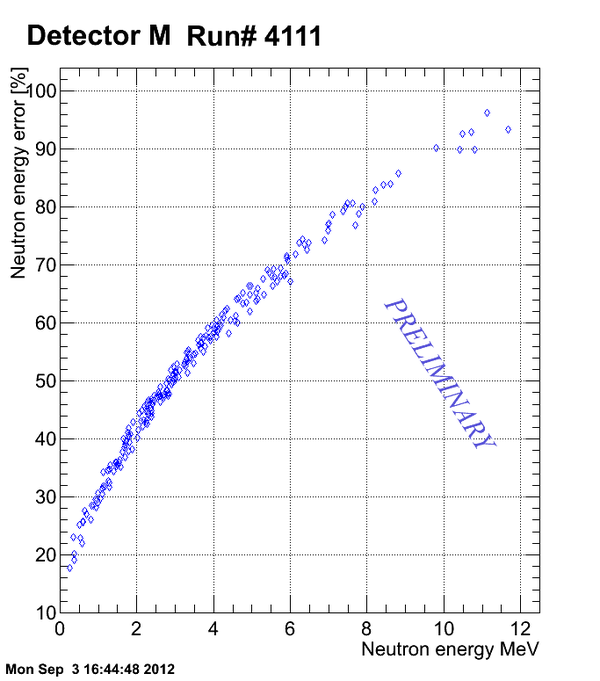
Errors on the neutron energy for the case of Det M:
Where uncertainty in the neutron flight pass due to the finite width of the detector (14.8 cm) and uncertainty in zero time definition in neutron TOF spectrum
Correlation between the neutron energy and neutron energy uncertainty is plotted below:
