Go Back
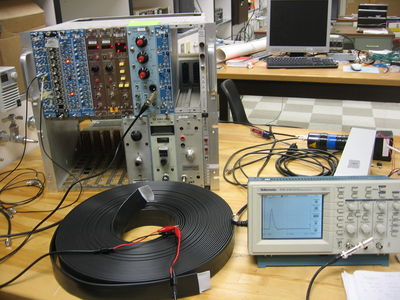
Experimental Set Up
| setup without Ribbon Cable |
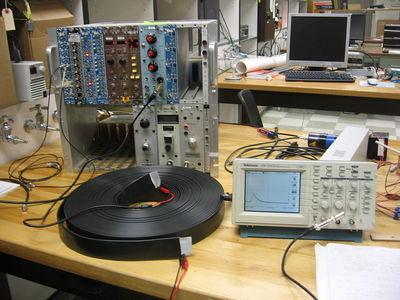
setup with Ribbon Cable
|
 |
|
Measurements
| Pulse width |
[math]V_1[/math] |
[math]V_2[/math] |
Attenuation, % |
Comments
|
| [math]100\ \mu s[/math] |
[math]5.0\ V[/math] |
[math]4.5\ V[/math] |
10 % |
|
| [math]10\ \mu s[/math] |
[math]5.0\ V[/math] |
[math]4.2\ V[/math] |
16 % |
|
| [math]1\ \mu s[/math] |
[math]5.0\ V[/math] |
[math]3.0\ V[/math] |
40 % |
see pictures about change of pulse shape
|
| [math]100\ ns[/math] |
[math]5.0\ V[/math] |
[math]2.8\ V[/math] |
44 % |
see pictures about change of pulse shape
|
| [math]30\ ns[/math] |
[math]4.0\ V[/math] |
[math]1.8\ V[/math] |
55 % |
see pictures about change of pulse shape
|
[math]V_1[/math] - without Ribbon Cable
[math]V_2[/math] - with Ribbon Cable
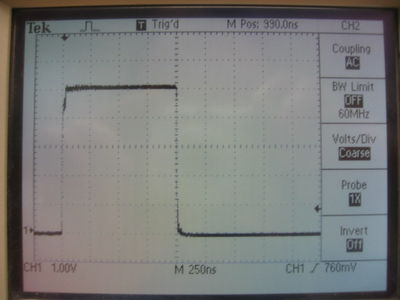
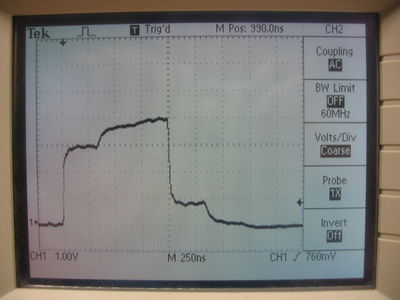
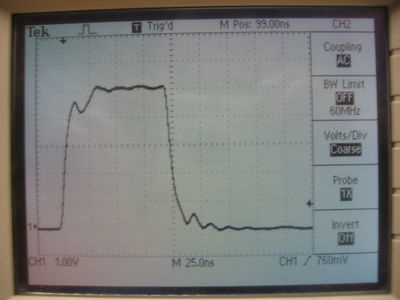
Pictures about change of pulse shape
| [math]1\ \mu s[/math] pulse without Ribbon Cable |
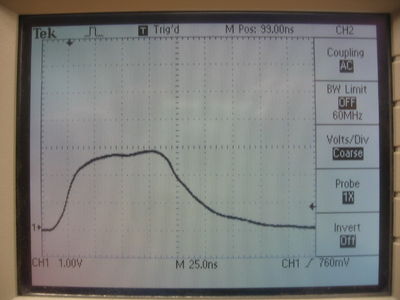
[math]1\ \mu s[/math] pulse with Ribbon Cable
|
 |
|
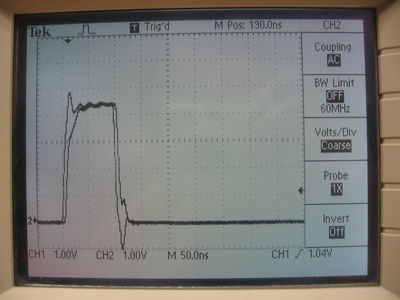
| [math]100\ ns[/math] pulse without Ribbon Cable |
[math]100\ ns[/math] pulse with Ribbon Cable
|
 |
|
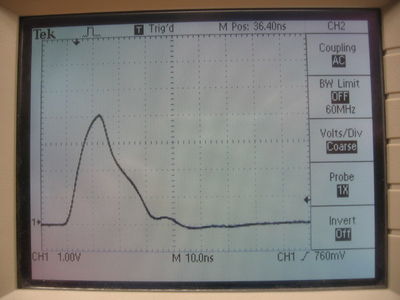
| [math]30\ ns[/math] pulse without Ribbon Cable |
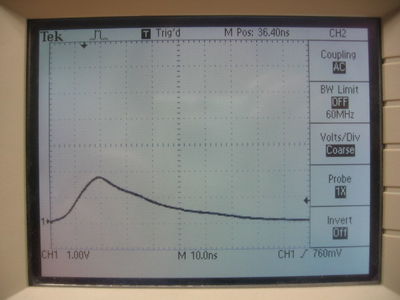
[math]30\ ns[/math] pulse with Ribbon Cable
|
 |
|
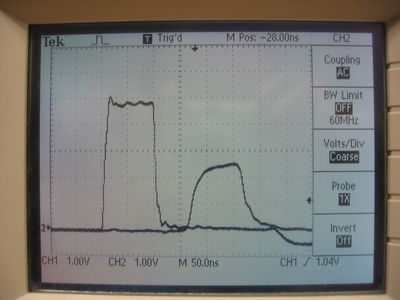
Signal Delay in Ribbon Cable
Experimental Setup
Measurements
| 2 pulses without Ribbon Cable |
2 pulses with Ribbon Cable
|
 |
|
We have about 170 ns delay of signal in Ribbon Cable for 100 ns pulse.
For other pulse width the delay is about the same.
Go Back


