QDC Analysis
The first test for the detector signal after installing U-233 is by using CAEN V792 Q-ADC (Analog charge to digital converter). The aim of this test is to test the shutter ability to help in distinguishing the emitted particles from U-233 source based on liberated charge from their ionization in gas.
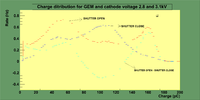
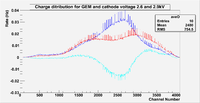
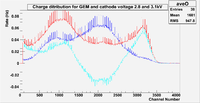
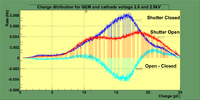 charge collected as the voltage is 2.60 2.90 kV for GEM and cathode successively |
|
|
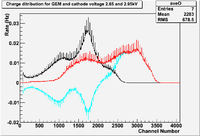
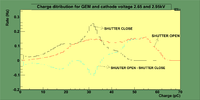 charge collected as the voltage is 2.65 2.95 kV for GEM and cathode successively |
|
|
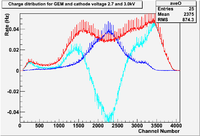
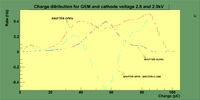 charge collected as the voltage is 2.70 3.00 kV for GEM and cathode successively |
|
|
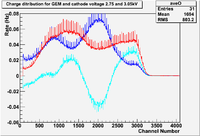
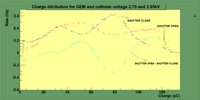 charge collected as the voltage is 2.75 3.05 kV for GEM and cathode successively |
|
|
 charge collected as the voltage is 2.80 3.10 kV for GEM and cathode successively |
|
 charge collected as the voltage is 2.60 2.90 kV for GEM and cathode successively |
|
|
 charge collected as the voltage is 2.65 2.95 kV for GEM and cathode successively |
|
|
 charge collected as the voltage is 2.70 3.00 kV for GEM and cathode successively |
|
|
 charge collected as the voltage is 2.75 3.05 kV for GEM and cathode successively |
|
|
 charge collected as the voltage is 2.80 3.10 kV for GEM and cathode successively |
|
A Non-linear increase in the charge collected by the Q-ADC as the voltage increases for GEM HV-circuit, also the figures show the change in the charge spectrum as the shutter position changed, shutter open's charge spectra show more collected charge than that of shutter close.
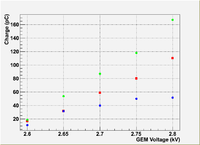 GEM voltage vs. the charge of the peaks appear as shutter is open and close |
|
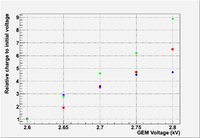 GEM voltage vs. the realtive gain of the peaks appear as shutter is open and close |
|
GO BACK [1]


