Difference between revisions of "PAA Selenium/Soil Experiments"
Jump to navigation
Jump to search
| Line 1: | Line 1: | ||
=October 2016= | =October 2016= | ||
| + | |||
| + | |||
| + | ==Preliminary Information Before Irradiation of Soil Sample== | ||
| + | |||
| + | Using Detector D at the IAC, I had to get a count on the unirradiated soil sample that was collected. Here are the GPS coordinates **** | ||
| + | |||
| + | Here is the spectrum produced: | ||
| + | |||
| + | [[File:Soil No Irr 10 21 16 logplot.png|200px]] | ||
| + | |||
| + | The details of the calibration along with the constants found from a linear fit of temperature vs. voltage can be found in the page below. | ||
| + | |||
| + | [[Calibration 10-21-16 Det D]] | ||
| + | [[Calibration 10-28-16 Det A]] | ||
| + | |||
| + | [[File:Soil Se Overlay.png|200px]] | ||
| + | [[File:Background Se Overlay.png|200px]] | ||
| + | |||
| + | ==Preliminary Information Before Irradiation of Soil Sample== | ||
| + | |||
| + | Using Detector D at the IAC, I had to get a count on the unirradiated soil sample that was collected. Here are the GPS coordinates **** | ||
| + | |||
| + | Here is the spectrum produced: | ||
| + | |||
| + | [[File:Soil No Irr 10 21 16 logplot.png|200px]] | ||
| + | |||
| + | The details of the calibration along with the constants found from a linear fit of temperature vs. voltage can be found in the page below. | ||
| + | |||
| + | [[Calibration 10-21-16 Det D]] | ||
| + | [[Calibration 10-28-16 Det A]] | ||
| + | |||
| + | [[File:Soil Se Overlay.png|200px]] | ||
| + | [[File:Background Se Overlay.png|200px]] | ||
Revision as of 04:00, 3 May 2017
October 2016
Preliminary Information Before Irradiation of Soil Sample
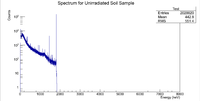
Using Detector D at the IAC, I had to get a count on the unirradiated soil sample that was collected. Here are the GPS coordinates ****
Here is the spectrum produced:
The details of the calibration along with the constants found from a linear fit of temperature vs. voltage can be found in the page below.
Calibration 10-21-16 Det D Calibration 10-28-16 Det A
Preliminary Information Before Irradiation of Soil Sample
Using Detector D at the IAC, I had to get a count on the unirradiated soil sample that was collected. Here are the GPS coordinates ****
Here is the spectrum produced:
The details of the calibration along with the constants found from a linear fit of temperature vs. voltage can be found in the page below.


